3. Pytorch
Overview
Questions
- How can we use images as inputs in a machine learning problem?
- How do we prepare the data for a deep learning model?
- What should we consider when designing a neural network architecture?
Objectives
- Understand how to train a deep learning model in Pytorch
- Understand how to use common data formats in climate science.
Tutorial of ENSO phase prediction with Deep Learning
This is a classification tutorial using Pytorch. Pytorch is an open source software used in machine learning particularly for training neural networks. Pytorch is an easy-to-use framework that is popular in the research community. It is similar to Tensorflow, but has a more pythonic interface. This tutorial will use a Pytorch convolutional neural network model to step through the basic workflow of a machine learning project involving image data:
- Install and import software libraries
- Download and preprocess data
- Define the training set
- Define a model
- Train the model
- Evaluate/test the model
Installing Pytorch
Installing deep learning software stacks can be tricky. Pytorch and other deep learning frameworks like Tensorflow and JAX are under rapid development and often depend on particular versions of dependencies.
Google Colab is the easiest way to do the following activity because Pytorch comes preinstalled. Otherwise, use Anaconda to install Pytorch in a new conda environment.
Getting familiar with deep learning on images data: MNIST dataset
![]()
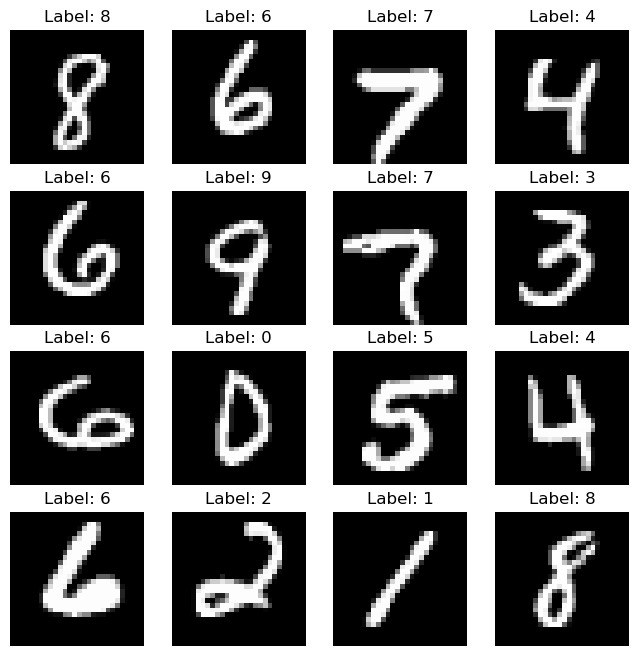
Before we start looking at climate data, we will build a simple image classification model using the MNIST dataset. This dataset consists of 70,000 images of handwritten digits (0-9) that are 28x28 pixels. The goal is to train a model that can correctly classify the digits.
Import Libraries
To start, import all the relevant libraries.
Code:
import matplotlib.pyplot as plt
import torch
import torch.nn as nn
from torch.utils.data import DataLoader
from torchvision import datasets
from torchvision.transforms import ToTensor
Select a device
Before we start, we need to select a device to train the model on. If you are using Google Colab, you can use a GPU by selecting Runtime -> Change runtime type -> Hardware accelerator -> GPU. If you are using your own computer, you can use a GPU if you have one available. Otherwise, you can use the CPU.
Code:
torch.device(
    "cuda"
    if torch.cuda.is_available()
    else "mps"
    if torch.backends.mps.is_available()
    else "cpu"
)
Download the MNIST dataset
As the MNIST dataset is a common dataset, it is already available in the torchvision package. We can download the data and preprocess it using the following code.
Code:
train_data = datasets.MNIST(
    root="data",
    train=True,
    download=True,
    transform=ToTensor(),
)

test_data = datasets.MNIST(
    root="data",
    train=False,
    download=True,
    transform=ToTensor(),
)
Here we also split the data into training and test sets. The training set is used to train the model, while the test set is used to evaluate the model. Machine learning models perform well on the data they are trained on, but the real test is how well they perform on unseen data. This is known as cross-validation.
Code:
print(train_data)
print(test_data)
Output:
Train data:
 Dataset MNIST
    Number of datapoints: 60000
    Root location: data
    Split: Train
    StandardTransform
Transform: ToTensor()

Test data:
 Dataset MNIST
    Number of datapoints: 10000
    Root location: data
    Split: Test
    StandardTransform
Transform: ToTensor()
The MNIST dataset is already split into training and test sets, but in general we need to do this ourselves. It is important to split the data randomly, but also to make sure that the training and test sets are representative of the entire dataset. For example, if the dataset is 90% class A and 10% class B, then the training and test sets should also be 90% class A and 10% class B.
We can plot some examples from the dataset to get a sense of what the data looks like.
figure = plt.figure(figsize=(8, 8))
cols, rows = 4, 4
for i in range(1, cols * rows + 1):
    sample_idx = torch.randint(len(train_data), size=(1,)).item()
    img, label = train_data[sample_idx]
    figure.add_subplot(rows, cols, i)
    plt.title(f"Label: {label}")
    plt.axis("off")
    plt.imshow(img.squeeze(), cmap="gray")
plt.show()
Prepare the data for training
We need to prepare the data for training. This involves creating a data loader that will feed the data into the model in batches. This is important because it is not feasible to load the entire dataset into memory at once. Instead, we load a small batch of data, perform a forward pass through the model, compute the loss, and then update the model parameters. This is known as stochastic gradient descent.
train_dataloader = DataLoader(train_data, batch_size=64, shuffle=True)
test_dataloader = DataLoader(test_data, batch_size=64, shuffle=True)
Define the model
For this particular problem, we will use a convolutional neural network (CNN). CNNs are a type of neural network that are particularly adept at processing image data. They are composed of a series of convolutional layers, which are layers that apply a filter to the input image. The filters can be thought of as small windows that slide across the image and extract features.
In Pytorch, we can define a CNN model by creating a class that inherits from the nn.Module class. We then define the layers of the model in the __init__ method, and define the forward pass in the forward method. The forward method takes in an input tensor and returns an output tensor.
class CNN(nn.Module):
    def __init__(self):
        super().__init__()
        self.conv1 = nn.Conv2d(in_channels=1, out_channels=8, kernel_size=3)
        self.pool = nn.MaxPool2d(kernel_size=2)
        self.conv2 = nn.Conv2d(in_channels=8, out_channels=16, kernel_size=3)
        self.fc1 = nn.Linear(in_features=16 * 5 * 5, out_features=128)
        self.fc2 = nn.Linear(in_features=128, out_features=10)

    def forward(self, x):
        x = self.pool(torch.relu(self.conv1(x)))
        x = self.pool(torch.relu(self.conv2(x)))
        x = torch.flatten(x, 1)
        x = torch.relu(self.fc1(x))
        x = self.fc2(x)
        return x
The model can be used by assigning it to a variable and calling it like a function.
Code:
model = CNN()
print(model)
Output:
CNN(
  (conv1): Conv2d(1, 8, kernel_size=(3, 3), stride=(1, 1))
  (pool): MaxPool2d(kernel_size=2, stride=2, padding=0, dilation=1, ceil_mode=False)
  (conv2): Conv2d(8, 16, kernel_size=(3, 3), stride=(1, 1))
  (fc1): Linear(in_features=400, out_features=128, bias=True)
  (fc2): Linear(in_features=128, out_features=10, bias=True)
)
Train the model
Now we are ready to train the model. We first define the loss function and the optimizer. The loss function is a measure of how well the model is performing. The optimizer is the algorithm that will update the model parameters to minimize the loss function. Here we use the cross entropy loss function and the Adam optimizer.
Code:
loss_fn = nn.CrossEntropyLoss()
optimizer = torch.optim.Adam(model.parameters(), lr=0.001)
We then define the training loop. This is where we iterate through the training examples, make predictions, and update the model parameters. We keep track of the average loss over the training set, and report it every time we iterate through the training dataset — each iteration through the training set is called an epoch.
Code:
epochs = 10
train_loss = []

for epoch in range(epochs):
    epoch_loss = []
    for batch_idx, (data, target) in enumerate(train_dataloader):
        # zero the parameter gradients
        # this is because the gradients are accumulated
        # so we need to zero them out at each iteration
        optimizer.zero_grad()

        # forward + backward + optimize
        output = model(data)
        loss = loss_fn(output, target)

        # we save the epoch loss to plot it later
        # it is multiplied by the batch size to account for the fact that
        # the loss is averaged over the batch
        epoch_loss.append(loss.item() * data.size(0))

        loss.backward()
        optimizer.step()

        # print statistics
        if batch_idx % 400 == 0:
            print(f"Epoch: {epoch}, Batch: {batch_idx}, Loss: {loss.item()}")
    train_loss.append(sum(epoch_loss) / len(train_data))
Output:
Epoch: 0, Batch: 0, Loss: 2.2953178882598877
Epoch: 0, Batch: 400, Loss: 0.1260863095521927
Epoch: 0, Batch: 800, Loss: 0.09389975666999817
Epoch: 1, Batch: 0, Loss: 0.09787891060113907
Epoch: 1, Batch: 400, Loss: 0.11758307367563248
Epoch: 1, Batch: 800, Loss: 0.036535874009132385
Epoch: 2, Batch: 0, Loss: 0.046887561678886414
Epoch: 2, Batch: 400, Loss: 0.1413286328315735
Epoch: 2, Batch: 800, Loss: 0.06275244057178497
Epoch: 3, Batch: 0, Loss: 0.03601439297199249
Epoch: 3, Batch: 400, Loss: 0.015198128297924995
Epoch: 3, Batch: 800, Loss: 0.09274444729089737
Epoch: 4, Batch: 0, Loss: 0.03338999301195145
Epoch: 4, Batch: 400, Loss: 0.07038191705942154
Epoch: 4, Batch: 800, Loss: 0.031227435916662216
Epoch: 5, Batch: 0, Loss: 0.026214195415377617
Epoch: 5, Batch: 400, Loss: 0.08040269464254379
Epoch: 5, Batch: 800, Loss: 0.036881931126117706
Epoch: 6, Batch: 0, Loss: 0.011896200478076935
Epoch: 6, Batch: 400, Loss: 0.02070874534547329
Epoch: 6, Batch: 800, Loss: 0.007654137443751097
Epoch: 7, Batch: 0, Loss: 0.041317518800497055
Epoch: 7, Batch: 400, Loss: 0.009546480141580105
Epoch: 7, Batch: 800, Loss: 0.0049569271504879
Epoch: 8, Batch: 0, Loss: 0.011140662245452404
Epoch: 8, Batch: 400, Loss: 0.00222363555803895
Epoch: 8, Batch: 800, Loss: 0.012186938896775246
Epoch: 9, Batch: 0, Loss: 0.005119095090776682
Epoch: 9, Batch: 400, Loss: 0.006383874453604221
Epoch: 9, Batch: 800, Loss: 0.0005414403858594596
How do I know if it’s working?
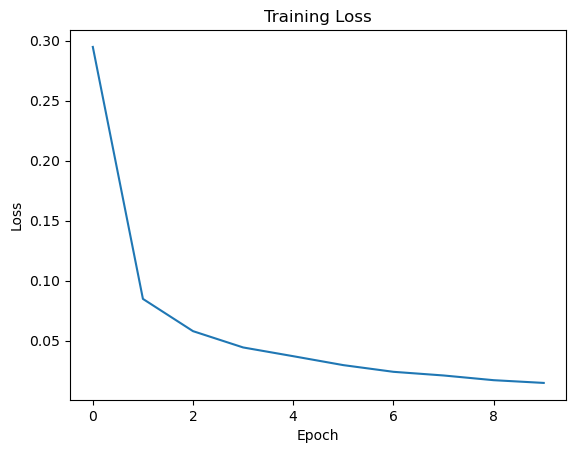
Training a neural network is notoriously difficult. The problem is that we are performing stochastic gradient descent optimization on a very non-convex function. You should look to see that the loss function decreases during the first few epochs, indicating that the model is improving. If it doesn’t, try decreasing the learning rate. If that doesn’t help, then you have a bug or the model is not appropriate for your problem.
How long do I train?
It is hard to know when to stop training, because even when the model seems to have converged, it might suddenly have “a revelation” that allows it to explain the training data perfectly. To build your intuition, we highly recommend playing with the toy neural networks in Tensorflow Playground.
In practice, we train until we run out of patience or when we start overfitting to a held out test set (known as early stopping).
It is useful to plot the training loss to see how the model is improving.
Code:
plt.plot(train_loss)
plt.title("Training Loss")
plt.xlabel("Epoch")
plt.ylabel("Loss")
plt.show()
Evaluate the model
Now we can evaluate the model on the test set. We first set the model to evaluation mode, then we iterate through the test set and make predictions. We then compare the predictions to the ground truth labels and compute the accuracy.
Code:
# set model to evaluation mode
model.eval()

# variables to keep track of accuracy
test_loss = []
correct = 0
total = 0

# we don't need to compute gradients for the test set
with torch.no_grad():
    for data, target in test_dataloader:
        output = model(data)
        loss = loss_fn(output, target)
        test_loss.append(loss.item() * data.size(0))
        _, predicted = torch.max(output.data, 1)
        total += target.size(0)
        correct += (predicted == target).sum().item()

print(f"Test Loss: {sum(test_loss) / len(test_data)}")
print(f"Test Accuracy: {100 * correct / total}%")
Output:
Test Loss: 0.03719360748641193
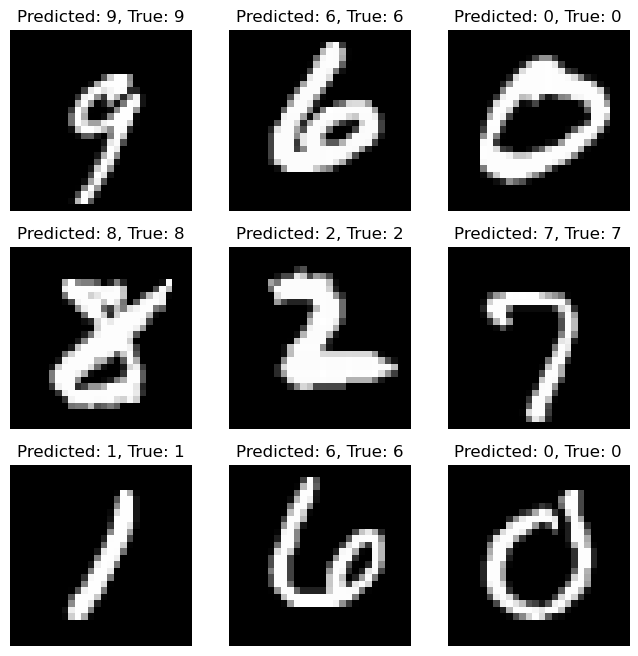
Test Accuracy: 98.71%
We can also visualize some of the predictions to get a sense of how well the model is performing after training.
Code:
fig, ax = plt.subplots(3, 3, figsize=(8, 8))
for i in range(3):
    for j in range(3):
        sample_idx = torch.randint(len(test_data), size=(1,)).item()
        img, label = test_data[sample_idx]
        output = model(img.unsqueeze(0))
        _, predicted = torch.max(output.data, 1)
        ax[i, j].imshow(img.squeeze(), cmap="gray")
        ax[i, j].set_title(f"Predicted: {predicted.item()}, True: {label}")
        ax[i, j].axis("off")
plt.show()
Climate Data: El Niño Southern Oscillation (ENSO) Phase Prediction
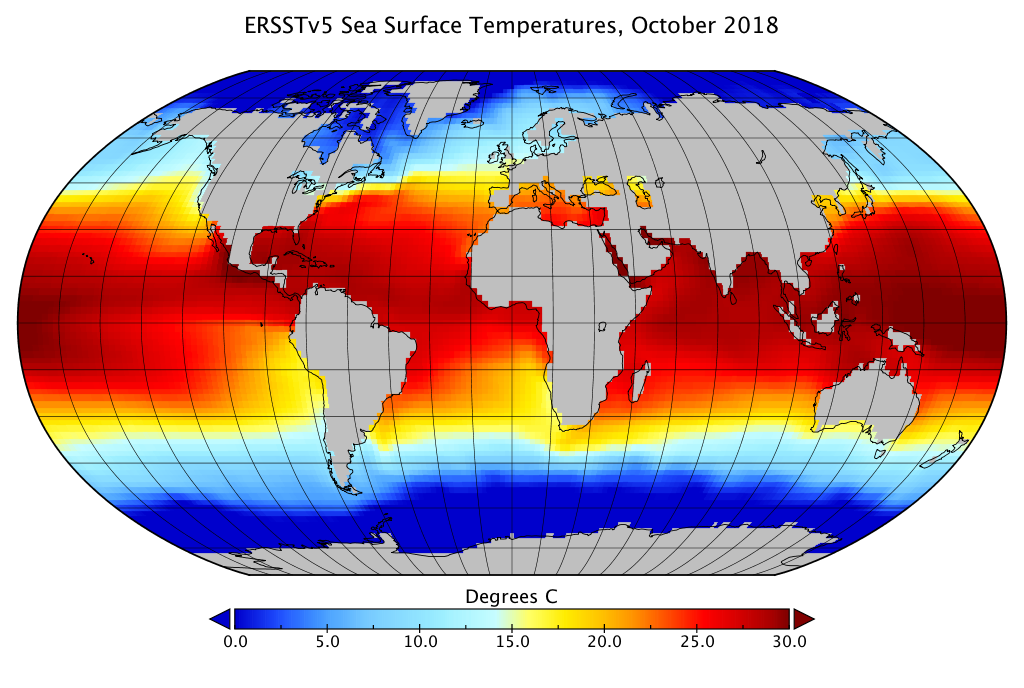
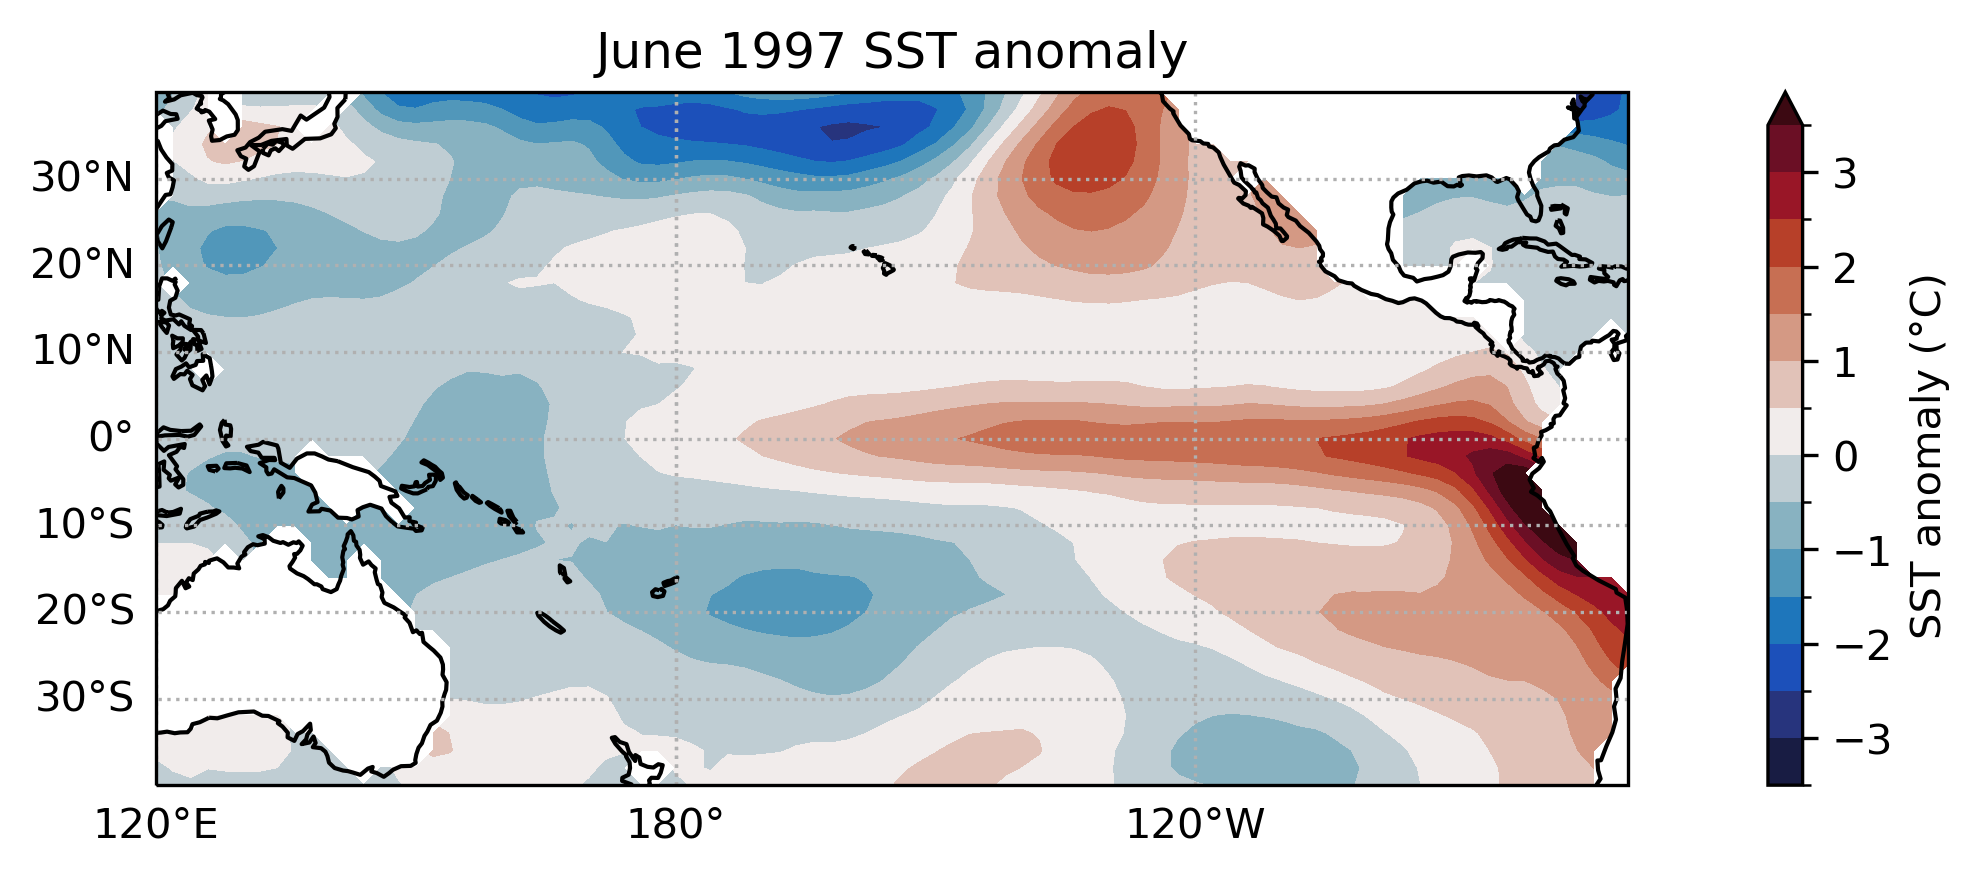
The El Niño Southern Oscillation (ENSO) is a climate phenomenon that occurs in the Pacific ocean. It is characterized by a periodic warming and cooling of the sea surface temperature. The ENSO phase can be classified into three categories: El Niño, La Niña, and Neutral. This event has a significant impact on weather patterns around the world, and is of great interest to climate scientists.
Sea Surface Temperature Data: NOAA Extended Reconstructed Sea Surface Temperature (ERSST) v5
The NOAA Extended Reconstructed Sea Surface Temperature (ERSST) v5 dataset is a global monthly sea surface temperature dataset. It is a blend of in situ and satellite data that begins in 1854 and is updated monthly. The data is available in netCDF format from the NOAA website.
A subset of the data has already been prepared for this workshop. In particular, we will focus our attention on a region in the Pacific ocean (40S-40N, 120E-100W) from 1854-2023. More specifically, we will use the sea surface temperature anomaly (SSTA) data, which is the difference between the sea surface temperature and the long-term average. This data is stored in a 3D array (time, lat, lon) in netCDF format, which is a common format for climate data.
NetCDF
NetCDF is a common data format for climate data. It is a self-describing format that is optimized for storing large arrays. It is supported by most programming languages and has a number of useful tools for working with the data. See the NetCDF website for more information.
Activity: ENSO Phase Prediction with Deep Learning
![]()
Exercise: Import dataset, check configuration
Import Libraries
To start, import all the relevant libraries.
import matplotlib.pyplot as plt
import pandas as pd
import torch
import torch.nn as nn
import xarray as xr
from torch.utils.data import DataLoader
First we select a device to train the model on. If you are using Google Colab, you can use a GPU by selecting Runtime -> Change runtime type -> Hardware accelerator -> GPU. If you are using your own computer, you can use a GPU if you have one available. Otherwise, you can use the CPU.
torch.device(
    "cuda"
    if torch.cuda.is_available()
    else "mps"
    if torch.backends.mps.is_available()
    else "cpu"
)
Download and Preprocess Data
Download the data from this link and move or upload the file into your jupyterlab workspace. Load the data into an xarray dataset using the xr.open_dataset function and select the variable ssta (sea surface temperature anomaly). The data is a 3D array (time, lat, lon) with missing values. We will fill in the missing values with zeros.
netcdf_file = xr.open_dataset("data/ersst_pacific_anom.nc")
ssta = (
    netcdf_file.ssta.expand_dims("channel")
    .transpose("time", "channel", "lat", "lon")
    .fillna(0)
)
We will now load the labels for the ENSO phase which has been prepared for this workshop and can be downloaded from this link. The labels are stored in a pandas dataframe with 4 columns: date, lead_1, lead_2, lead_3. The date column is the date of the observation, while the lead columns are the ENSO phase 1, 2, and 3 months in the future. The ENSO phase has been converted to a categorical variable with 3 classes: 0 (Neutral), 1 (El Niño), and 2 (La Niña).
labels_df = pd.read_csv("data/labels.csv")
one_hot_labels = nn.functional.one_hot(
    torch.from_numpy(labels_df[["lead_1", "lead_2", "lead_3"]].values).long(),
    num_classes=3,
).float()
One Hot Encoding
One hot encoding is a method for converting categorical variables into numerical variables. For example, if we have a variable that can take on the values “red”, “green”, and “blue”, we can convert this into a numerical variable by assigning each category a number: 0, 1, and 2. However, this implies that “red” is closer to “green” than it is to “blue”, which is not true. One hot encoding solves this problem by creating a new variable for each category. In this case, we would have three variables: red, green, and blue. If the original variable was “red”, then the red variable would be 1 and the green and blue variables would be 0. If the original variable was “blue”, then the blue variable would be 1 and the red and green variables would be 0. This is a more appropriate representation of the data.
| color | Red | Green | Blue |
|---|---|---|---|
| Red | 1 | 0 | 0 |
| Green | 0 | 1 | 0 |
| Blue | 0 | 0 | 1 |
Define the Training Set
Now that we have the data loaded, we need to prepare it in a format that Pytorch can use. We will define a dataset class that will take in the data and labels and return a single example. We will then use the Pytorch DataLoader class to create a data loader that will feed the data into the model in batches.
class ENSODataset(torch.utils.data.Dataset):
    def __init__(self, ssta, labels):
        self.ssta = ssta
        self.labels = labels

    def __len__(self):
        return len(self.ssta)

    def __getitem__(self, idx):
        return self.ssta[idx], self.labels[idx]


# we will use the first 80% of the data for training and the last 20% for testing
train_size = int(0.8 * len(ssta))

train_dataset = ENSODataset(ssta[:train_size].data.copy(), one_hot_labels[:train_size])
test_dataset = ENSODataset(ssta[train_size:].data.copy(), one_hot_labels[train_size:])
Creating Train/Test Splits
In machine learning, it is critical to split the data into “training” and “test” sets. The training set is used to train the model, while the test set is used to evaluate the model. Machine learning models tend to memorize the training data, so the training error always goes to zero — the only way to know if the model generalizes to new data is by evaluating the performance on the test set, a method known as cross-validation.
In timeseries data, there is a danger of information leakage where the training set is highly correlated to the test set (even if the exact examples are different). Thus, it is common use chrono-cross-validation, where the training data consists of examples before a certain time T, while the test set consists of examples after time T.
We will use a batch size of 32 and shuffle the training data.
train_dataloader = DataLoader(train_dataset, batch_size=32, shuffle=True)
test_dataloader = DataLoader(test_dataset, batch_size=32)
Defining the Model
Similar to the MNIST example, we will use a convolutional neural network (CNN) model as we are working with image data. As we want to predict the next 3 months of ENSO phase, we will have 3 output nodes (one for each lead time) each with 3 possible values (one for each ENSO phase). We will use the cross entropy loss function and the Adam optimizer.
class ENSOModel(nn.Module):
    def __init__(self):
        super().__init__()
        self.conv1 = nn.Conv2d(1, 6, 3)
        self.pool = nn.MaxPool2d(2, 2)
        self.conv2 = nn.Conv2d(6, 16, 3)
        self.fc1 = nn.Linear(16 * 8 * 20, 120)
        self.fc2 = nn.Linear(120, 84)
        self.fc3 = nn.Linear(84, 3)

    def forward(self, x):
        x = self.pool(torch.relu(self.conv1(x)))
        x = self.pool(torch.relu(self.conv2(x)))
        x = torch.flatten(x, 1)  # flatten all dimensions except batch
        x = torch.relu(self.fc1(x))
        x = torch.relu(self.fc2(x))

        x_lead_1 = self.fc3(x)
        x_lead_2 = self.fc3(x)
        x_lead_3 = self.fc3(x)

        return x_lead_1, x_lead_2, x_lead_3
Designing a neural network architecture
The neural network architecture can have a large impact on performance. The inductive bias of a model refers to the set of assumptions and prior beliefs that are inherent in this choice. All machine learning models have inductive bias. This is not a bad thing, but it means some models are more appropriate for some problems than others. This is formalized in what is known as The No Free Lunch Theorem.
Experienced practicioners know which architectures tend to work best for certain types of problems. Bigger models usually work better, but are slower because of computational constraints. In practice, it is common to try lots of different models and perform model selection to pick the best based on how well the model performs on a test set.
Training the Model
Training the model is an iterative process. Starting from randomly initialized parameters, we iterate through the training examples, make predictions, and update the weight parameters to minimize the loss function. In this case, we use the cross entropy loss. We keep track of the average loss over the training set, and report it every time we iterate through the training dataset — each iteration through the training set is called an epoch.
We can now write the training loop.
# Initialize the model
model = ENSOModel()

# define the loss function and optimizer
loss_fn = nn.CrossEntropyLoss()
optimizer = torch.optim.SGD(model.parameters(), lr=0.001, momentum=0.9)

# train the model
epochs = 60
train_loss = []

for epoch in range(epochs):
    epoch_loss = []

    # set model to training mode
    model.train()

    for batch_idx, (data, target) in enumerate(train_dataloader):
        optimizer.zero_grad()

        # forward + backward + optimize
        output_lead_1, output_lead_2, output_lead_3 = model(data)
        loss = (
            loss_fn(output_lead_1, target[:, 0])
            + loss_fn(output_lead_2, target[:, 1])
            + loss_fn(output_lead_3, target[:, 2])
        )

        epoch_loss.append(loss.item() * data.size(0))

        loss.backward()
        optimizer.step()

        # print statistics
        if batch_idx % 400 == 0:
            print(f"Epoch: {epoch}, Batch: {batch_idx}, Loss: {loss.item()}")
    train_loss.append(sum(epoch_loss) / len(train_dataset))
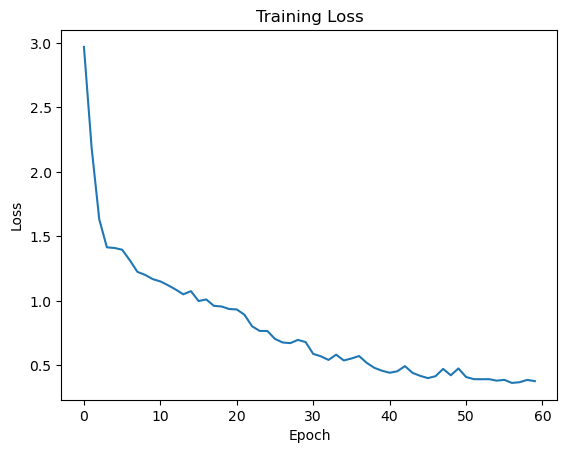
The training loss should decrease during the first few epochs, indicating that the model is improving. If it doesn’t, try decreasing the learning rate. If that doesn’t help, then you have a bug or the model is not appropriate for your problem.
plt.plot(train_loss)
plt.title("Training Loss")
plt.xlabel("Epoch")
plt.ylabel("Loss")
plt.show()
Evaluating the Model
Now we can evaluate the model on the test set. We first set the model to evaluation mode, then we iterate through the test set and make predictions. We then compare the predictions to the ground truth labels and compute the accuracy.
model.eval()

# test the accuracy per lead

correct_lead_1 = 0
correct_lead_2 = 0
correct_lead_3 = 0

with torch.no_grad():
    for data, target in test_dataloader:
        output_lead_1, output_lead_2, output_lead_3 = model(data)

        _, predicted_lead_1 = torch.max(output_lead_1.data, 1)
        _, predicted_lead_2 = torch.max(output_lead_2.data, 1)
        _, predicted_lead_3 = torch.max(output_lead_3.data, 1)

        _, target_lead_1 = torch.max(target[:, 0], 1)
        _, target_lead_2 = torch.max(target[:, 1], 1)
        _, target_lead_3 = torch.max(target[:, 2], 1)

        correct_lead_1 += (predicted_lead_1 == target_lead_1).sum().item()
        correct_lead_2 += (predicted_lead_2 == target_lead_2).sum().item()
        correct_lead_3 += (predicted_lead_3 == target_lead_3).sum().item()

# print the accuracy per lead in %
print(f"Accuracy Lead 1: {100 * correct_lead_1 / len(test_dataset)}")
print(f"Accuracy Lead 2: {100 * correct_lead_2 / len(test_dataset)}")
print(f"Accuracy Lead 3: {100 * correct_lead_3 / len(test_dataset)}")
Output:
Accuracy Lead 1: 70.52%
Accuracy Lead 2: 67.08%
Accuracy Lead 3: 60.69%
Forecast with December 2023
We can now use the model to make a forecast. We will use the December 2023 data as input to the model and see what the model predicts for the next 3 months. You can download the data from this link
dec2023 = xr.open_dataset("data/ersst_anom_dec2023.nc").ssta

model.eval()

pred_input = torch.from_numpy(
    dec2023.expand_dims("channel")
    .transpose("channel", "lat", "lon")
    .fillna(0)
    .data.copy()
)

with torch.no_grad():
    model_output = model(pred_input.unsqueeze(0))

print("0: Neutral, 1: El Nino, 2: La Nina")
print(f"Prediction for January 2024: {model_output[0].argmax()}")
print(f"Prediction for February 2024: {model_output[1].argmax()}")
print(f"Prediction for March 2024: {model_output[2].argmax()}")
Output:
0: Neutral, 1: El Nino, 2: La Nina
Prediction for January 2024: 1
Prediction for February 2024: 1
Prediction for March 2024: 1
Improving the model
If we want to improve the model, the first thing to ask ourselves is whether we are underfitting or overfitting. If we are not overfitting, then we are underfitting and we should increase the size of the model and train longer. If we are overfitting, then we should add regularization or get more training data.