5. Common Methods on Series or DataFrames
![]()
Overview
Questions
- What are some common attributes of Pandas
DataFrames? - What are some common methods of Pandas
DataFrames? - How can you do arithmetic between two Pandas columns?
Objectives
- Learn new attributes and methods of a
DataFrame. - Learn how to obtain statistics from a loaded
DataFrame. - Learn how to perform pairwise operations on Pandas
DataFramecolumns.
DataFrame Attributes and Arithmetic
Once you have loaded one or more DataFrames, you may want to investigate various aspects of the data. This could be done by looking at the shape (number of rows and columns) of the DataFrame or the mean of a single column. This could also involve computing arithmetic operations across columns (i.e. Series). The following module focuses on these two concepts and will help you better understand how you can analyze the data you have loaded into Pandas.
DataFrame Attributes
A DataFrame provides various attributes to access information (metadata) about the data it stores. Among these attributes, the ‘shape’ attribute, previously introduced, provides the number of rows and columns. However, several other attributes convey information such as data types and the total number of values. When exploring a dataset, the following four attributes are particularly valuable:
| Attribute | Description |
|---|---|
shape |
Returns a tuple representing the dimensionality of the DataFrame. |
size |
Returns an int representing the number of elements in this object. |
dtypes |
Returns the data types in the DataFrame. |
columns |
Returns a Series of the header names from the DataFrame |
For more information
A list of all the DataFrame attributes can be found on the Pandas website (Link to DataFrame Docs).
Inspecting Data Types
DataFrame data types determine which methods are applicable to a column. For instance, calculating the mean of an Object column is not feasible, as Pandas interprets this type as containing strings (i.e., textual data).
We have already used .columns attribute to return column labels.
Python
df.columns
That returns:
Index(['Sample ID', 'date mmddyy', 'press dbar', 'temp ITS-90', 'csal PSS-78',
       'coxy umol/kg', 'ph'],
      dtype='object')
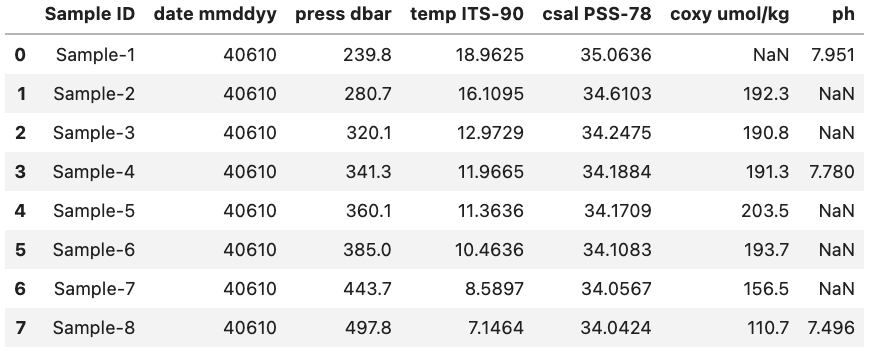
However, what if we wanted to see the data type associated with each column header? Luckily, there is a quick and easy way to do this by accessing the dtypes attribute. dtypes is a series maintained by each DataFrame that contains the data type for each column inside a DataFrame. As an example, if we want to access the dtypes attribute the DataFrame called df (seen below) we can access the dtypes of the DataFrame.
Python
df.dtypes
Output:
Sample ID        object
date mmddyy       int64
press dbar      float64
temp ITS-90     float64
csal PSS-78     float64
coxy umol/kg    float64
ph              float64
dtype: object
Data Types
Remember that Pandas has a number of different data types:
| Python Type | Equivalent Pandas Type | Description |
|---|---|---|
string or mixed |
object |
Columns contain partially or completely made up from strings |
int |
int64 |
Columns with numeric (integer) values. The 64 here refers to size of the memory space allocated to this type |
float |
float64 |
Columns with floating points numbers (numbers with decimal points) |
bool |
bool |
True/False values |
datetime |
datetime |
Date and/or time values |
Pandas can automatically infer column types, but manual specification is required when necessary. For instance, below we will use the column named ‘date mmddyy’ to derive a new column named ‘date’ with the data type ‘datetime’.
We convert the data in the ‘date mmddyy’ column to a new ‘datetime’ Series using the ‘to_datetime’ method, specifying the date format as ‘%m%d%y’, which in date formatting language mean month day and then year with each denoted by two numbers and no separators. This format parameter is based on native Python string conversion to datetime format. More information can be found in the Python docs. (Link to string to datetime conversion docs)
For more information
More information on the to_datetime method can be found on the Pandas website (Link to to_datetime method docs).
Python
pd.to_datetime(df['date mmddyy'], format='%m%d%y')
Output
0   2010-04-06
1   2010-04-06
2   2010-04-06
3   2010-04-06
4   2010-04-06
5   2010-04-06
6   2010-04-06
7   2010-04-06
Name: date mmddyy, dtype: datetime64[ns]
Now that we have the correct output format, we can create a new column to hold the converted data by creating a new named column. We will also drop the previously used ‘date mmddyy’ column to prevent confusion.
Python
df["date"] = pd.to_datetime(df['date mmddyy'], format='%m%d%y')
df = df.drop(columns=["date mmddyy"])
df.dtypes
Output
Sample ID               object
press dbar             float64
temp ITS-90            float64
csal PSS-78            float64
coxy umol/kg           float64
ph                     float64
date            datetime64[ns]
dtype: object
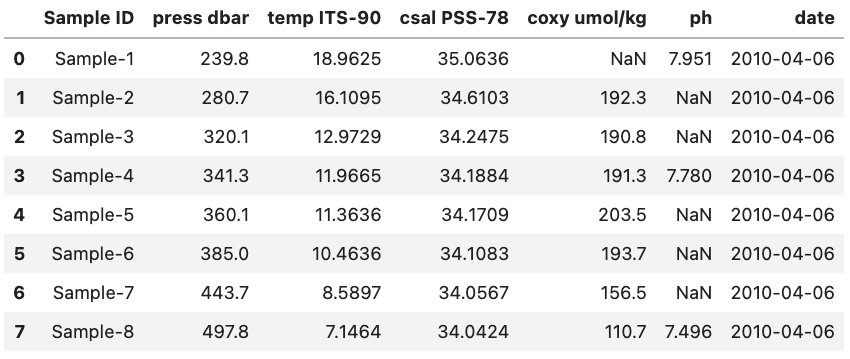
For reference, this is what the final DataFrame looks like. Note that the date column is at the right side of the DataFrame since it was added last.
DataFrame Methods
When dealing with a DataFrame, there are various built-in methods to help summarize the data. Mehtods are accessible using the df.method() syntax, where df is a DataFrame. A list of some of these methods is provided below:
| Method | Description |
|---|---|
head() |
Return the first n rows. |
tail() |
Return the last n rows. |
min(), max() |
Computes the numeric (for numeric value) or alphanumeric (for object values) row-wise min, max in a Series or DataFrame. |
sum(), mean(), std(), var() |
Computes the row-wise sum, mean, standard deviation and variance in a Series or DataFrame. |
nlargest() |
\tReturn the first n rows of the Series or DataFrame, ordered by the specified columns in descending order. |
count() |
Returns the number of non-NaN values in the in a Series or DataFrame. |
value_counts() |
Returns the frequency for each value in the Series. |
describe() |
Computes row-wise statistics. |
For more information
A full list of methods for DataFrames can be found in the Pandas documentation (Link to DataFrame Docs).
In this section, we will explore the mean() method, which serves as a typical example of method behavior. Subsequently, we will employ the describe() method, which presents more complex functionality.
mean() Method
The mean() method calculates the mean across a given axis (rows = 0, columns = 1). As an example let’s reuse our previous DataFrame df.
If we want to find the mean of all our numeric columns, we could use the following command:
Python
df.mean(numeric_only=True)
Output:
press dbar      358.562500
temp ITS-90      12.196838
csal PSS-78      34.311013
coxy umol/kg    176.971429
ph                7.742333
dtype: float64
Note: only the columns with numeric data types had their means calculated.
Single Column (Series) Methods
If we only want the mean of a single column we would instead give the mean() method a single column (i.e. a Series). This could be done for the latitude column in the example above via the code bit df['Latitude'].mean() which would return a single value 31.09682 which is the mean of that column (as seen above).
Other methods like max(), var(), and count() work the same way as mean().
describe() Method
The describe() method offers a variety of statistical summaries for the DataFrame based on its contents, with some customization options demonstrated below.
By default, the describe() method will only use numeric columns. To tell it to use all columns regardless of whether they are numeric or not we have to use include='all' as a parameter.
Python
df.describe(include='all', datetime_is_numeric=True)
Output:
       Sample ID  press dbar  temp ITS-90  csal PSS-78  coxy umol/kg  \
count          8    8.000000     8.000000     8.000000      7.000000
unique         8         NaN          NaN          NaN           NaN
top     Sample-1         NaN          NaN          NaN           NaN
freq           1         NaN          NaN          NaN           NaN
mean         NaN  358.562500    12.196838    34.311013    176.971429
min          NaN  239.800000     7.146400    34.042400    110.700000
25%          NaN  310.250000     9.995125    34.095400    173.650000
50%          NaN  350.700000    11.665050    34.179650    191.300000
75%          NaN  399.675000    13.757050    34.338200    193.000000
max          NaN  497.800000    18.962500    35.063600    203.500000
std          NaN   83.905762     3.853666     0.353064     32.726376

              ph                 date
count   3.000000                    8
unique       NaN                  NaN
top          NaN                  NaN
freq         NaN                  NaN
mean    7.742333  2010-04-06 00:00:00
min     7.496000  2010-04-06 00:00:00
25%     7.638000  2010-04-06 00:00:00
50%     7.780000  2010-04-06 00:00:00
75%     7.865500  2010-04-06 00:00:00
max     7.951000  2010-04-06 00:00:00
std     0.229827                  NaN
Here we get various statistics, such as the mean of each column, how many non-NaN values contained in each column, the standard deviation of the column, etc. The percent values correspond to the different percentiles of each column e.g. the 25% percentile. The presence of NaN values indicates that certain statistics, e.g., the mean(), cannot be computed for an object type column.
For more information
More information about the describe() method can be found on the Pandas website (Link to describe() method docs).
Accessor Methods
For Series containing specialized data types (like strings, datetime values, or categorical data), Pandas provides accessors to offer specialized methods for those data types. These are accessed as series.accessor.method() where series is a Series object. Here are some of the examples of accessors and their methods:
| Method | Description |
|---|---|
upper() |
Converts strings in the Series to uppercase. |
lower() |
Converts strings in the Series to lowercase. |
len() |
Computes the length of each string. |
year, month, day, hour |
Returns the year, month, day and hour of the datetime. |
categories |
Returns the categories of the Series. |
ordered |
Checks if the categories have an order. |
Pandas provides accessors, i.e., mechanisms that enable you to use specialized methods and functions tailored for specific data types, such as strings, datetime values, or categorical data. These accessors provide access to methods tailored to these data types. Access to these methods is achieved through the syntax series.data_type.method(), where series represents a Series object. Below are examples of these accessors and their corresponding methods as used on sample dataframes:
Python
pd.Series(['cat', 'dog', 'fish']).str.upper()
Output:
0      CAT
1      DOG
2      FISH
dtype: object
Python
# Create a Pandas Series containing datetime values
dates = pd.to_datetime(['2023-01-15', '2023-02-20', '2023-03-25'])

# Use the datetime accessor to extract the day of the week
day_of_week = dates.dt.day_name()
Output:
0    Sunday
1    Monday
2  Saturday
dtype: object
For more information
A full list of methods for Accessor can be found in the Pandas docs.
Link to String method docs
Link to Datetime method docs
Link to Categorical method docs
DataFrame Arithmetic
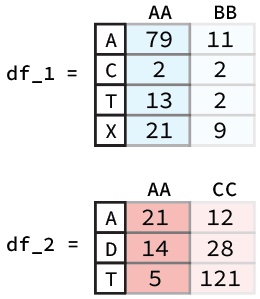
To perform arithmetic operations between columns or rows of distinct Pandas DataFrames, Pandas provides a straightforward solution. For instance, if we have two DataFrames as depicted below and wish to add the ‘AA’ columns together, we can achieve this by utilizing the following code snippet:
Python
df_1["AA"] + df_2["AA"]
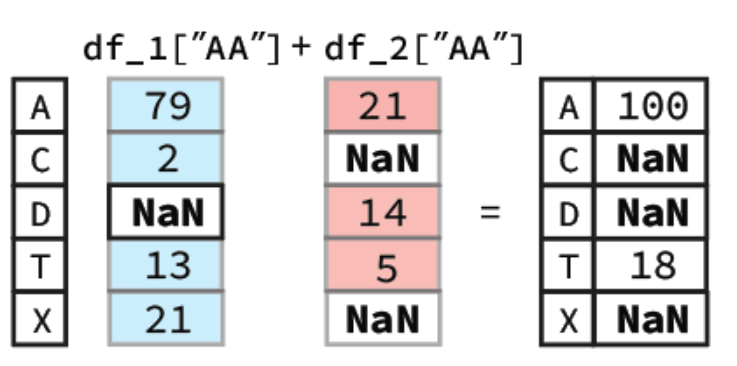
To perform this operation, Pandas will first align the two columns (Series) based on their indexes. Following this, any indexes that contain values in both Series will have their sum calculated. However, for indexes where one of the Series value is NaN the output value will be NaN. A diagram of this process is shown below:
In our notebook we would get a Series as our output:
Output
A    100.0
C      NaN
D      NaN
T     18.0
X      NaN
Name: AA, dtype: float64
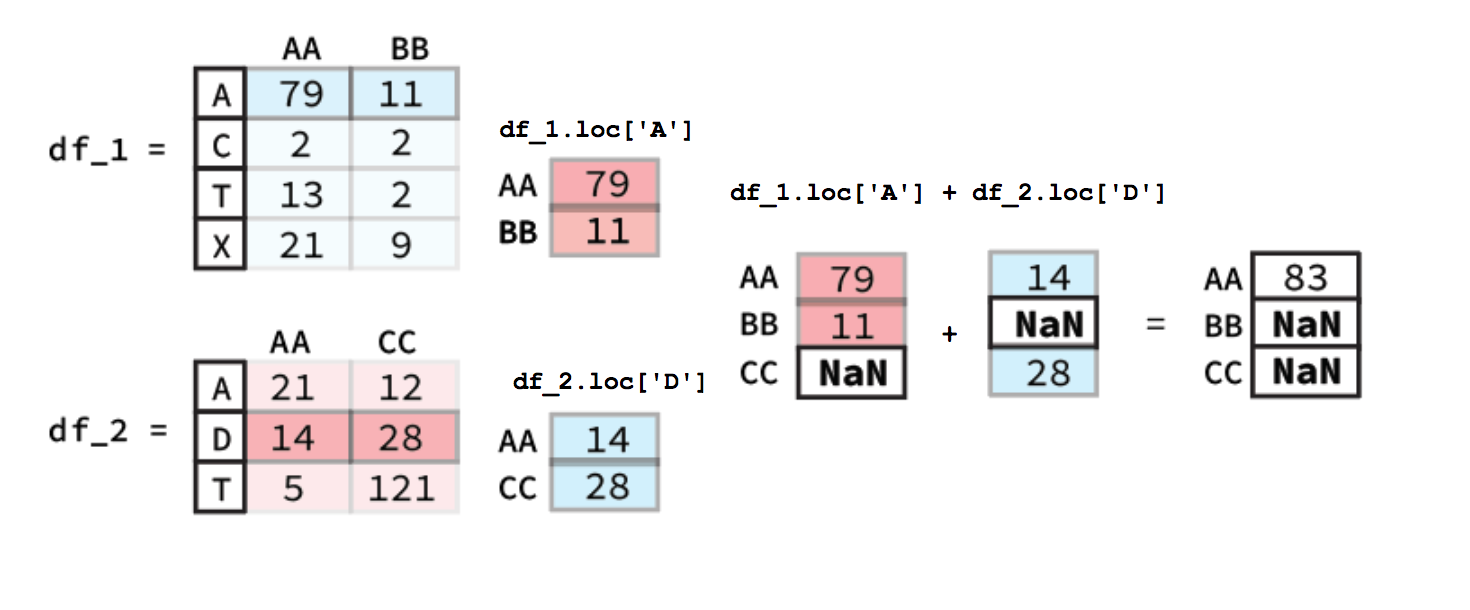
DataFrame Row Arithmetic
Calculating the sum across different rows is quite similar to column-wise calculations. The key difference is that you must use a method for selecting rows, such as .loc. An illustrative figure is shown below.
Broadcasting
Pandas also allows you to do arithmetic operations between a DataFrame or Series and a scalar (i.e. a single number). If you were to do the following code bit using the ‘AA’ column from the previously described DataFrame called df_1
Python
df_1["AA"] + 0.3
Output:
A    79.3
C     2.3
T    13.3
X    21.3
Name: AA, dtype: float64
Here you essentially just add 0.3 to each entry in the Series. The same occurs if you were to do it for a whole DataFrame with 0.3 being added to each entry. Note: this only works for DataFrames that are entirely numeric, if there are any object columns you will get an error message.
Key Points
- Use
.dtypesto get the types of each column in aDataFrame. - To get general statistics on the DataFrame you can use the
describemethod. - You can add a constant to a numeric column by using the
column + constant.
Exercise: Analyzing and Modifying the Data Set
Let’s dive deeper into our 20_sales_records.xlsx file.
- First, compute the mean, minimum, and maximum of the “Total Profit” column.
- Convert the “Sales Channel” column entries from lowercase to uppercase.
Solution
Step 1: Start by reading the data set and computing the desired statistics for the "Total Profit" column.
  df = pd.read_excel('data/20_sales_records.xlsx')
  mean_profit = df["Total Profit"].mean()
  min_profit = df["Total Profit"].min()
  max_profit = df["Total Profit"].max()
  print(f"Mean Total Profit: {mean_profit}")
  print(f"Minimum Total Profit: {min_profit}")
  print(f"Maximum Total Profit: {max_profit}")
You should get the following outputs:
  Mean Total Profit: $467,929.09
  Minimum Total Profit: $7,828.12
  Maximum Total Profit: $1,487,261.02
Step 2: Convert the "Sales Channel" column to uppercase.
  df["Sales Channel"] = df["Sales Channel"].str.upper()
  df["Sales Channel"].head()
The output should now display the "Sales Channel" entries in uppercase.