Beyond Basic Charts
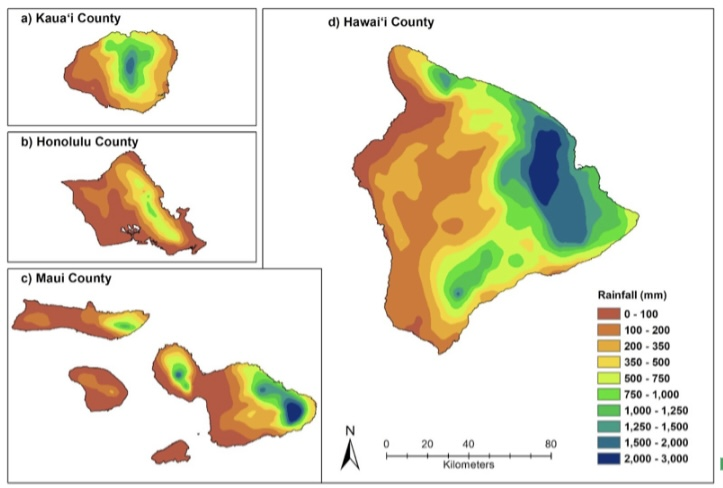
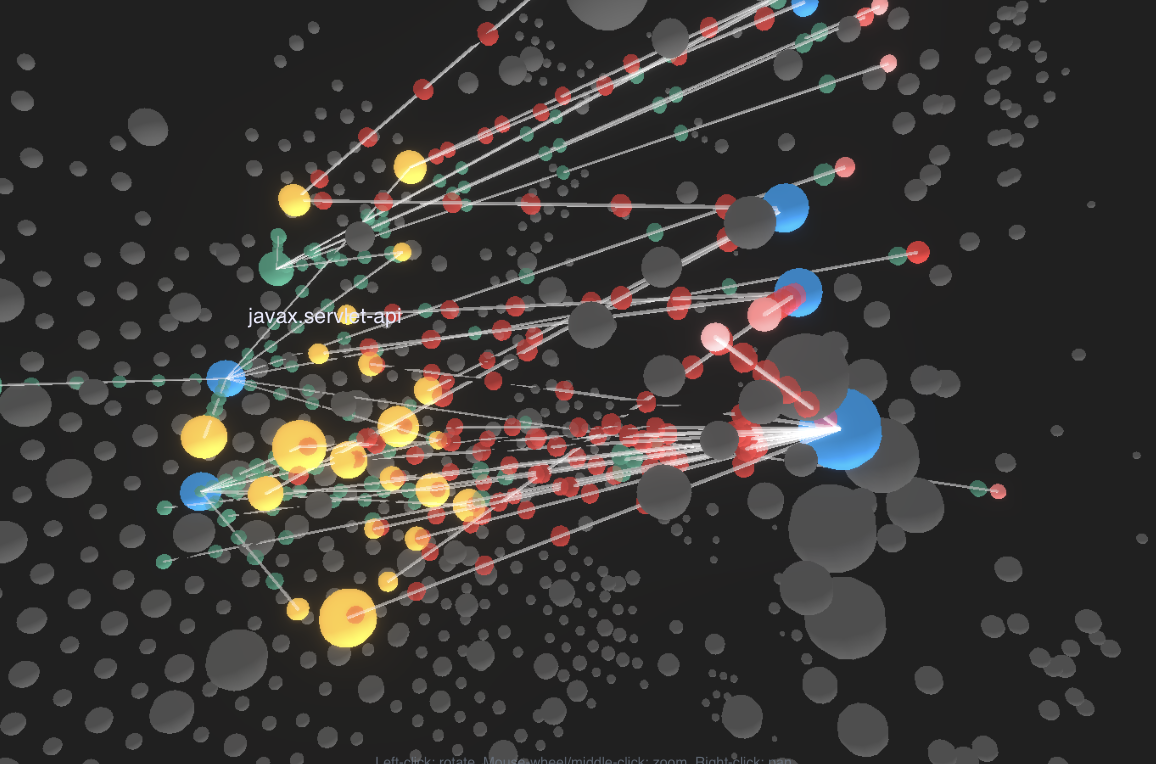
Visualization takes many forms beyond the basic charts. Commonly you will see map based visualizations or node and link graphs. For example, the following visualizations show a choropleth map based on gridded data and a 3D graph.
In some cases, an animation is the end product of analysis (for example, simulation of dynamic fluids), in which case, the visualization product is the full animation.
In other cases, animation can be used:
- To show change over time in an intuitive way (cool example)
- Switch focus between different 3D portions of the visualization
- Add storytelling features such as audio narration
- Impose a linear narrative structure of viewing the data
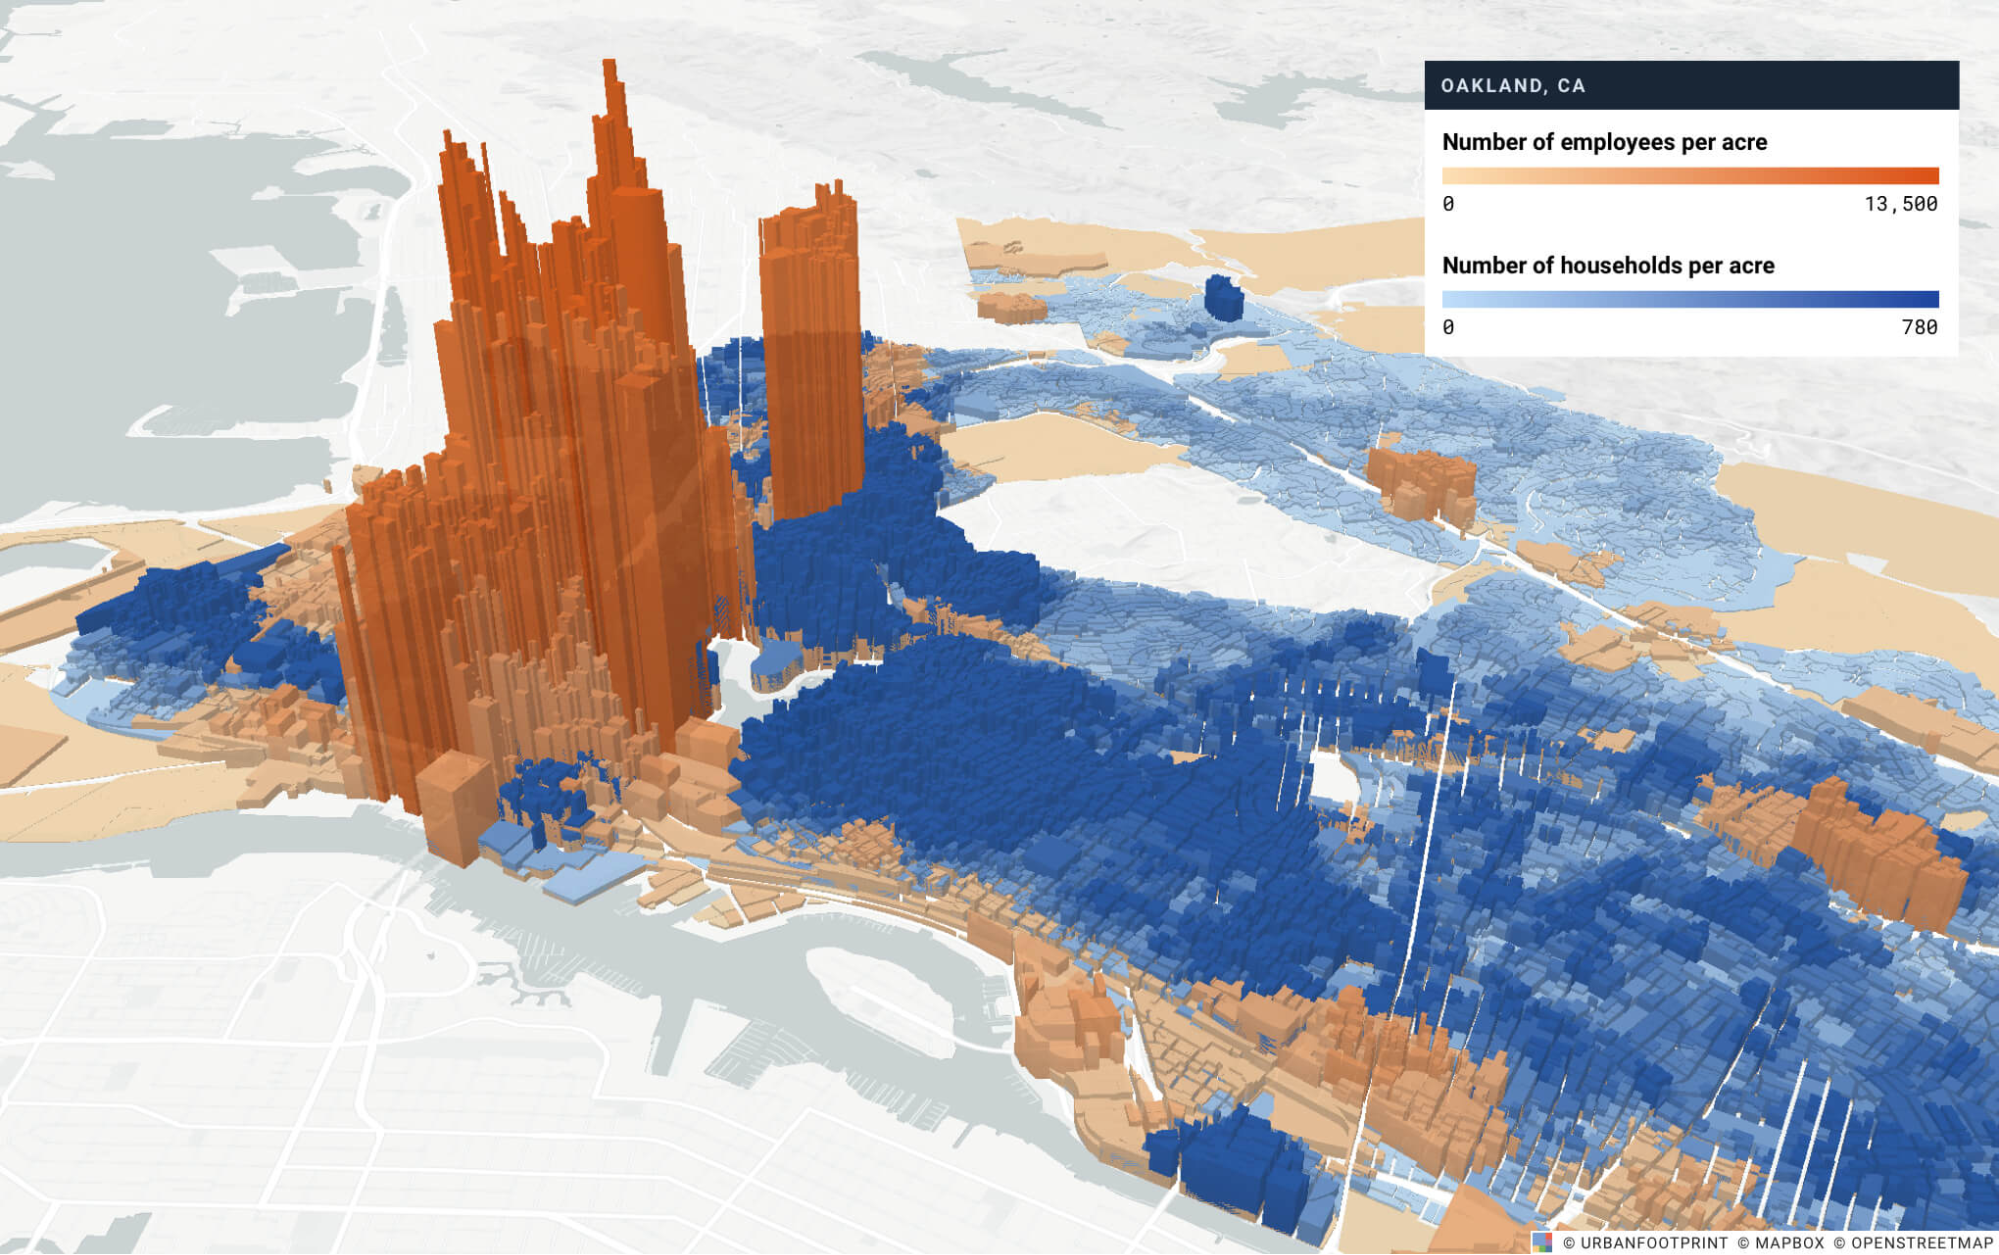
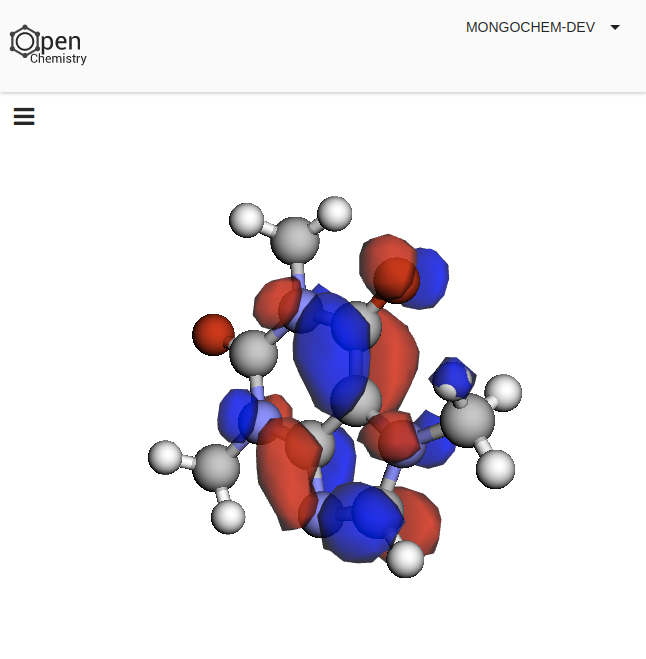
3D visualizations are another way to convey complex data and, in many cases, represent scientific data that has spatial significance or are based on 3D objects in the real world.
Paraview is an example of a free tool used by many scientists to visualize 3D elements and explore isosurfaces (surfaces of constant scalar value). The video below (created by Dr. Jason Leigh) shows a quick demonstration of Pawaview.
A visualization class will be available to both undergraduate and graduate students next semester with several spots reserved for data science students. We go more into depth about all of these topics and more.