5. Creating Visualizations Using Tableau
Overview
Objectives
- Provide you with an introduction to the Tableau User interface.
- Help you get started with simple graph plotting with Tableau.
Tableau Tutorial
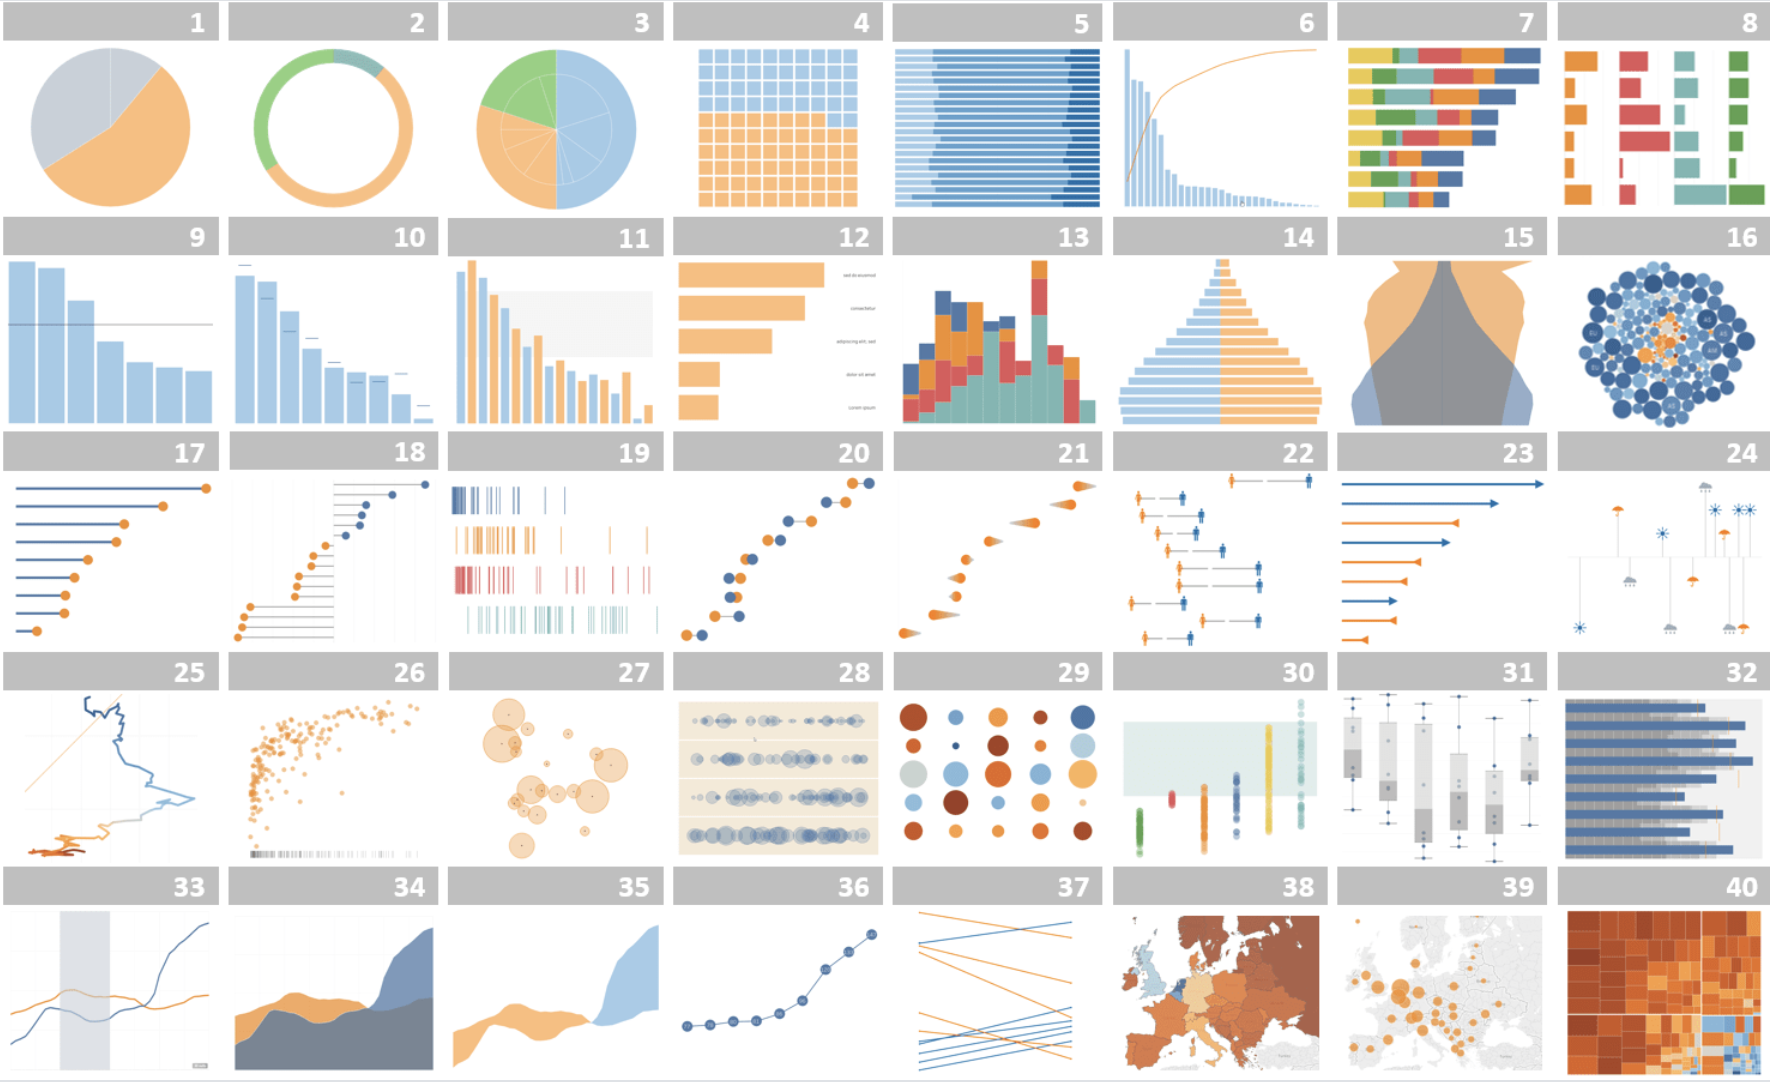
Tableau is an interactive data visualization platform that allows users to easily and quickly analyze and visualize data. This allows for simple comparisons and important insights into large sets of data. This software was founded by three computer scientists at Stanford with the goal of making data analysis more accessible. Tableau’s patented technology, VizQL, allows data to be dragged and dropped for quick figures to be created and analyzed.
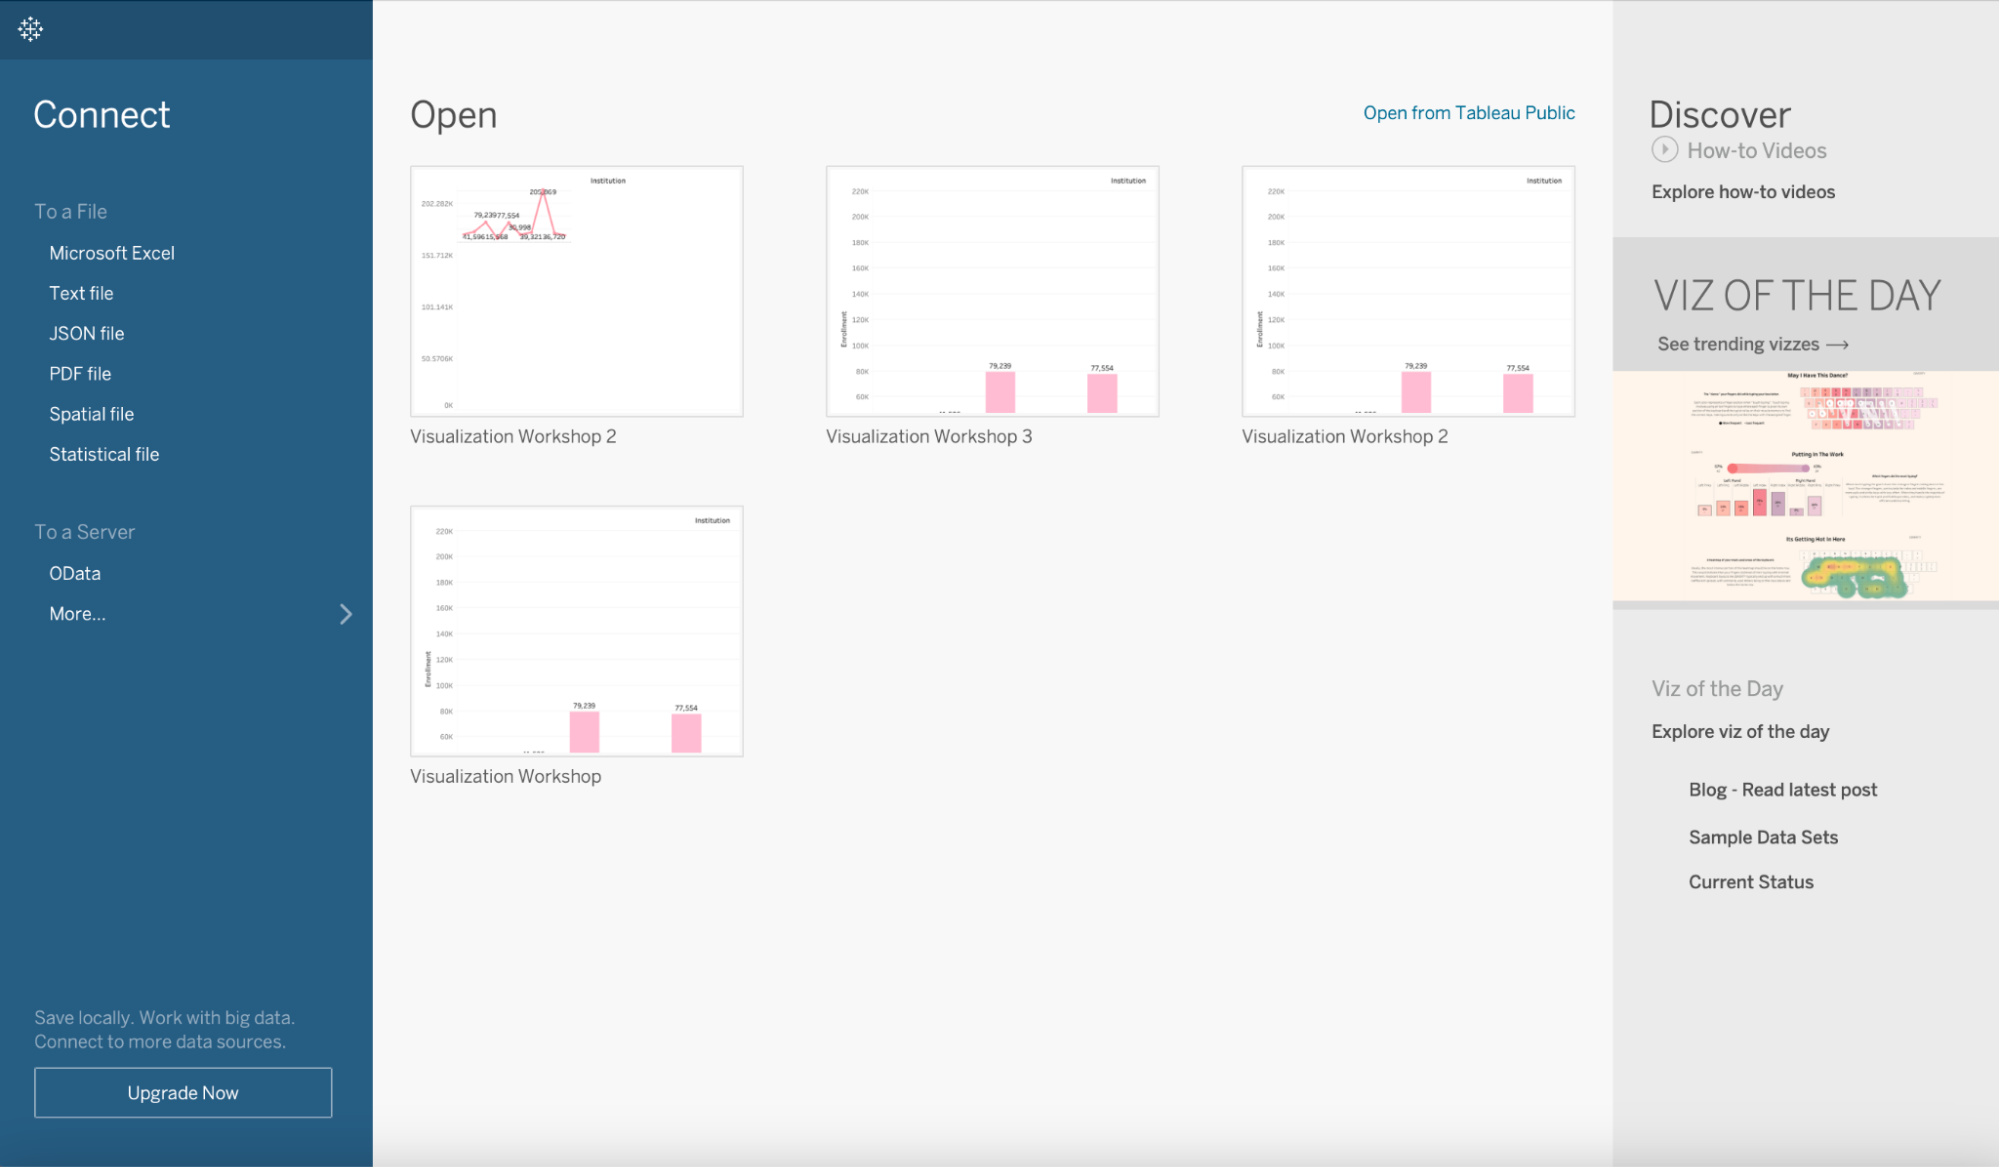
This is the Tableau initial interface and allows you to upload an array of different data file types as seen as the far left. The middle pane shows you past workbooks as shown in this screenshot above under the “Open” title.
- Upload data file provided for this example; we will be using the same data set for both examples in this workshop.
- I used an excel file
- This application is like excel since you work on a book and can add multiple sheets that can display different graphs. However, you are able to see your data uploaded on the left hand side and will transfer between each sheet worked on. There is also a dashboard available to view your figures side by side to compare visually.
- Visualization 1: bar graph (x-axis: enrollment, y-axis: institution)
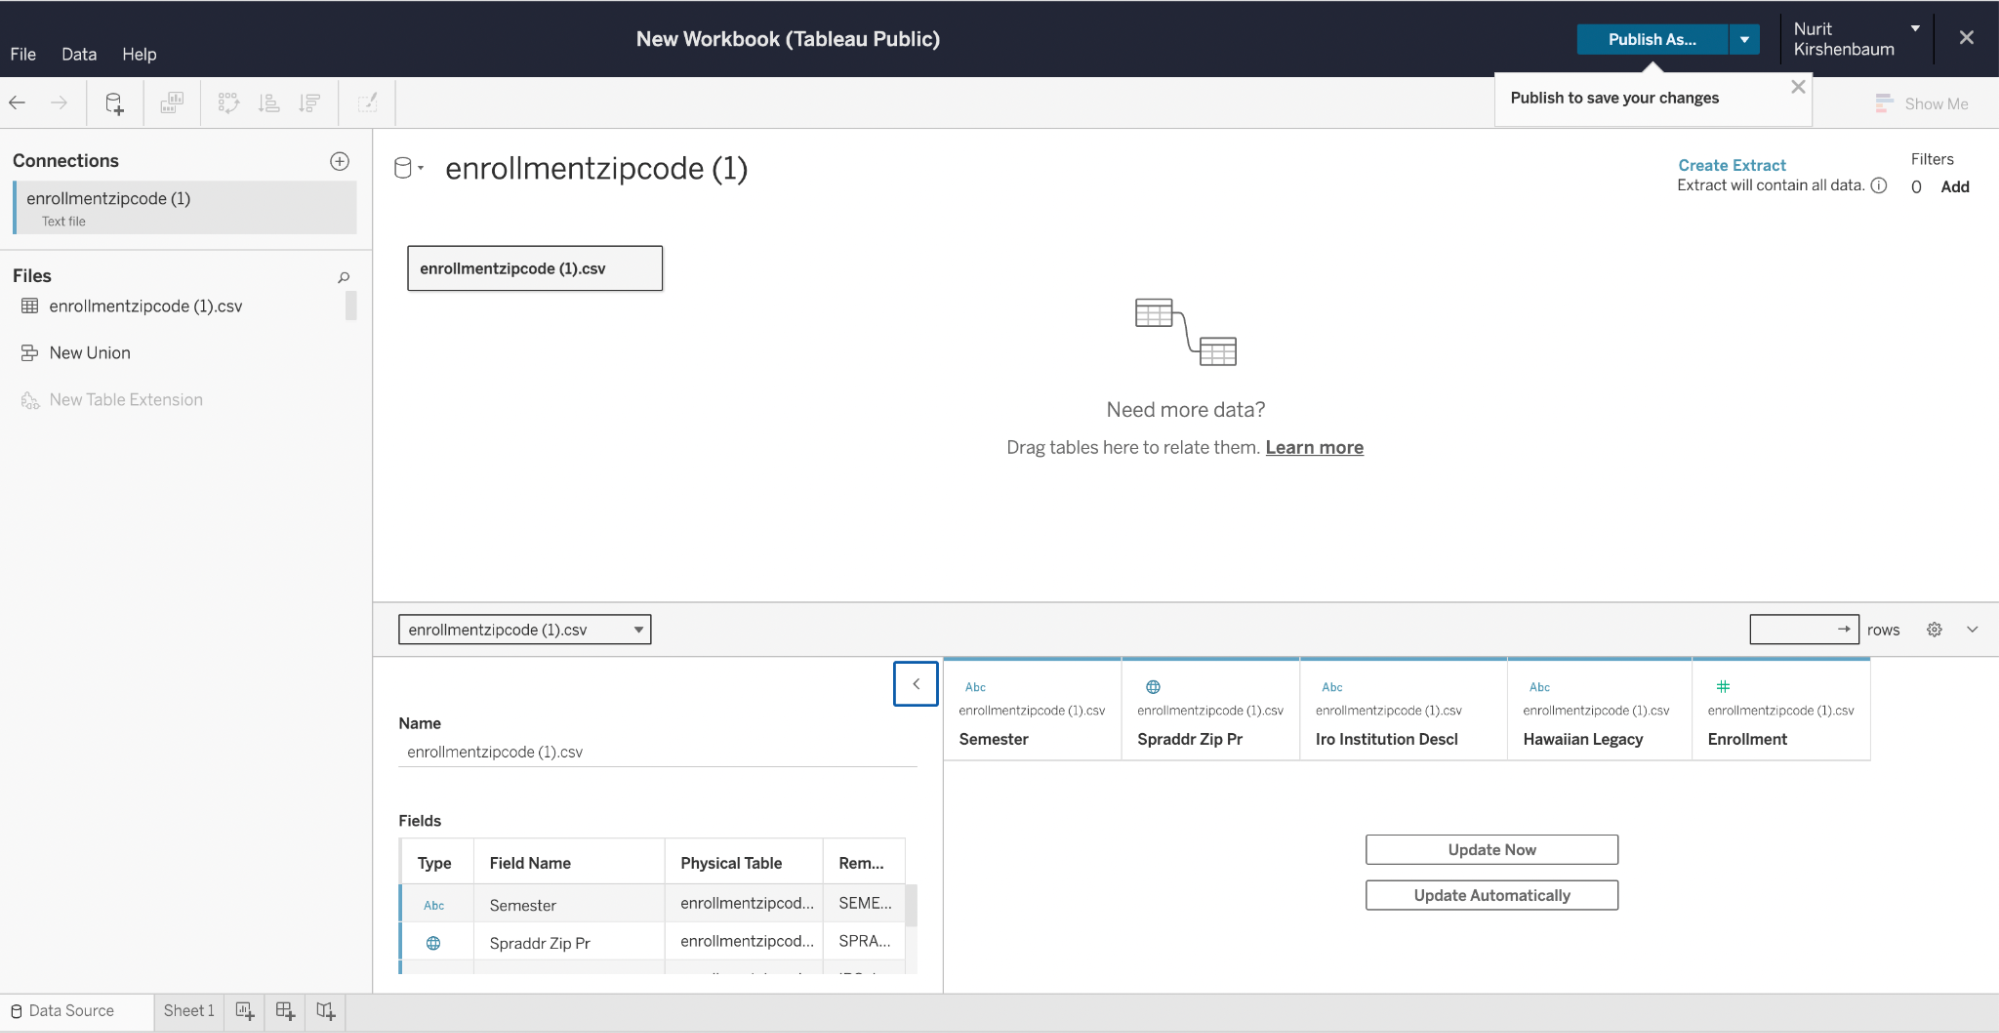
- Data source tab shows the different components of your uploaded data set to be able to quickly choose what you wish to observe and compare. The sheet tabs allow you to make different figures and use different aspects of your data.
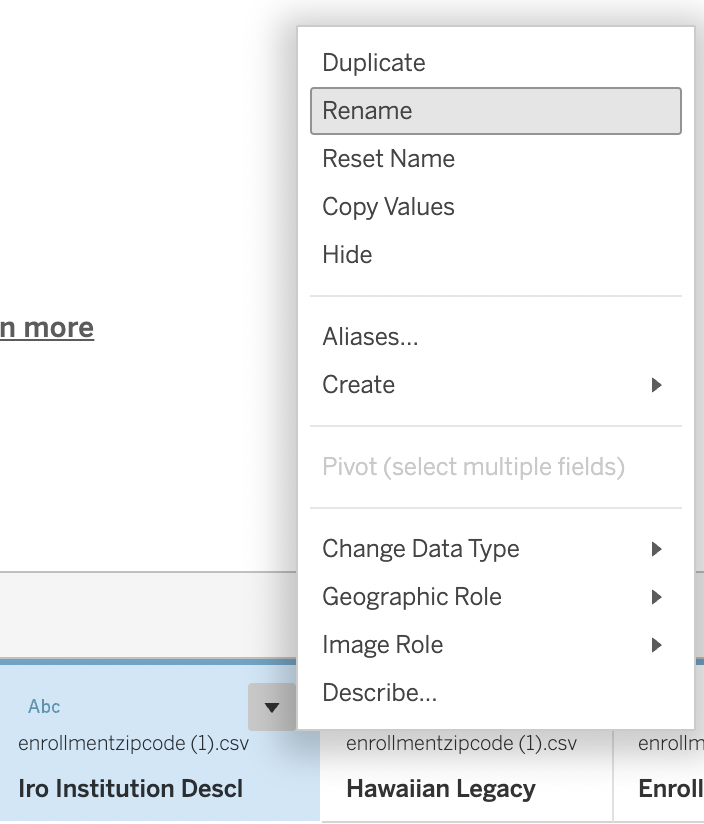
- Change the name of “Iro Institution Descl” to “Institution” by right clicking the field and pressing “Rename”
- Drag “Enrollment” field to the rows section at the top of sheet 1 and “Institution” field to the columns section at the top of sheet 1.
- In the “Show Me” window on the right side of the Book click the bar graph icon to display figure
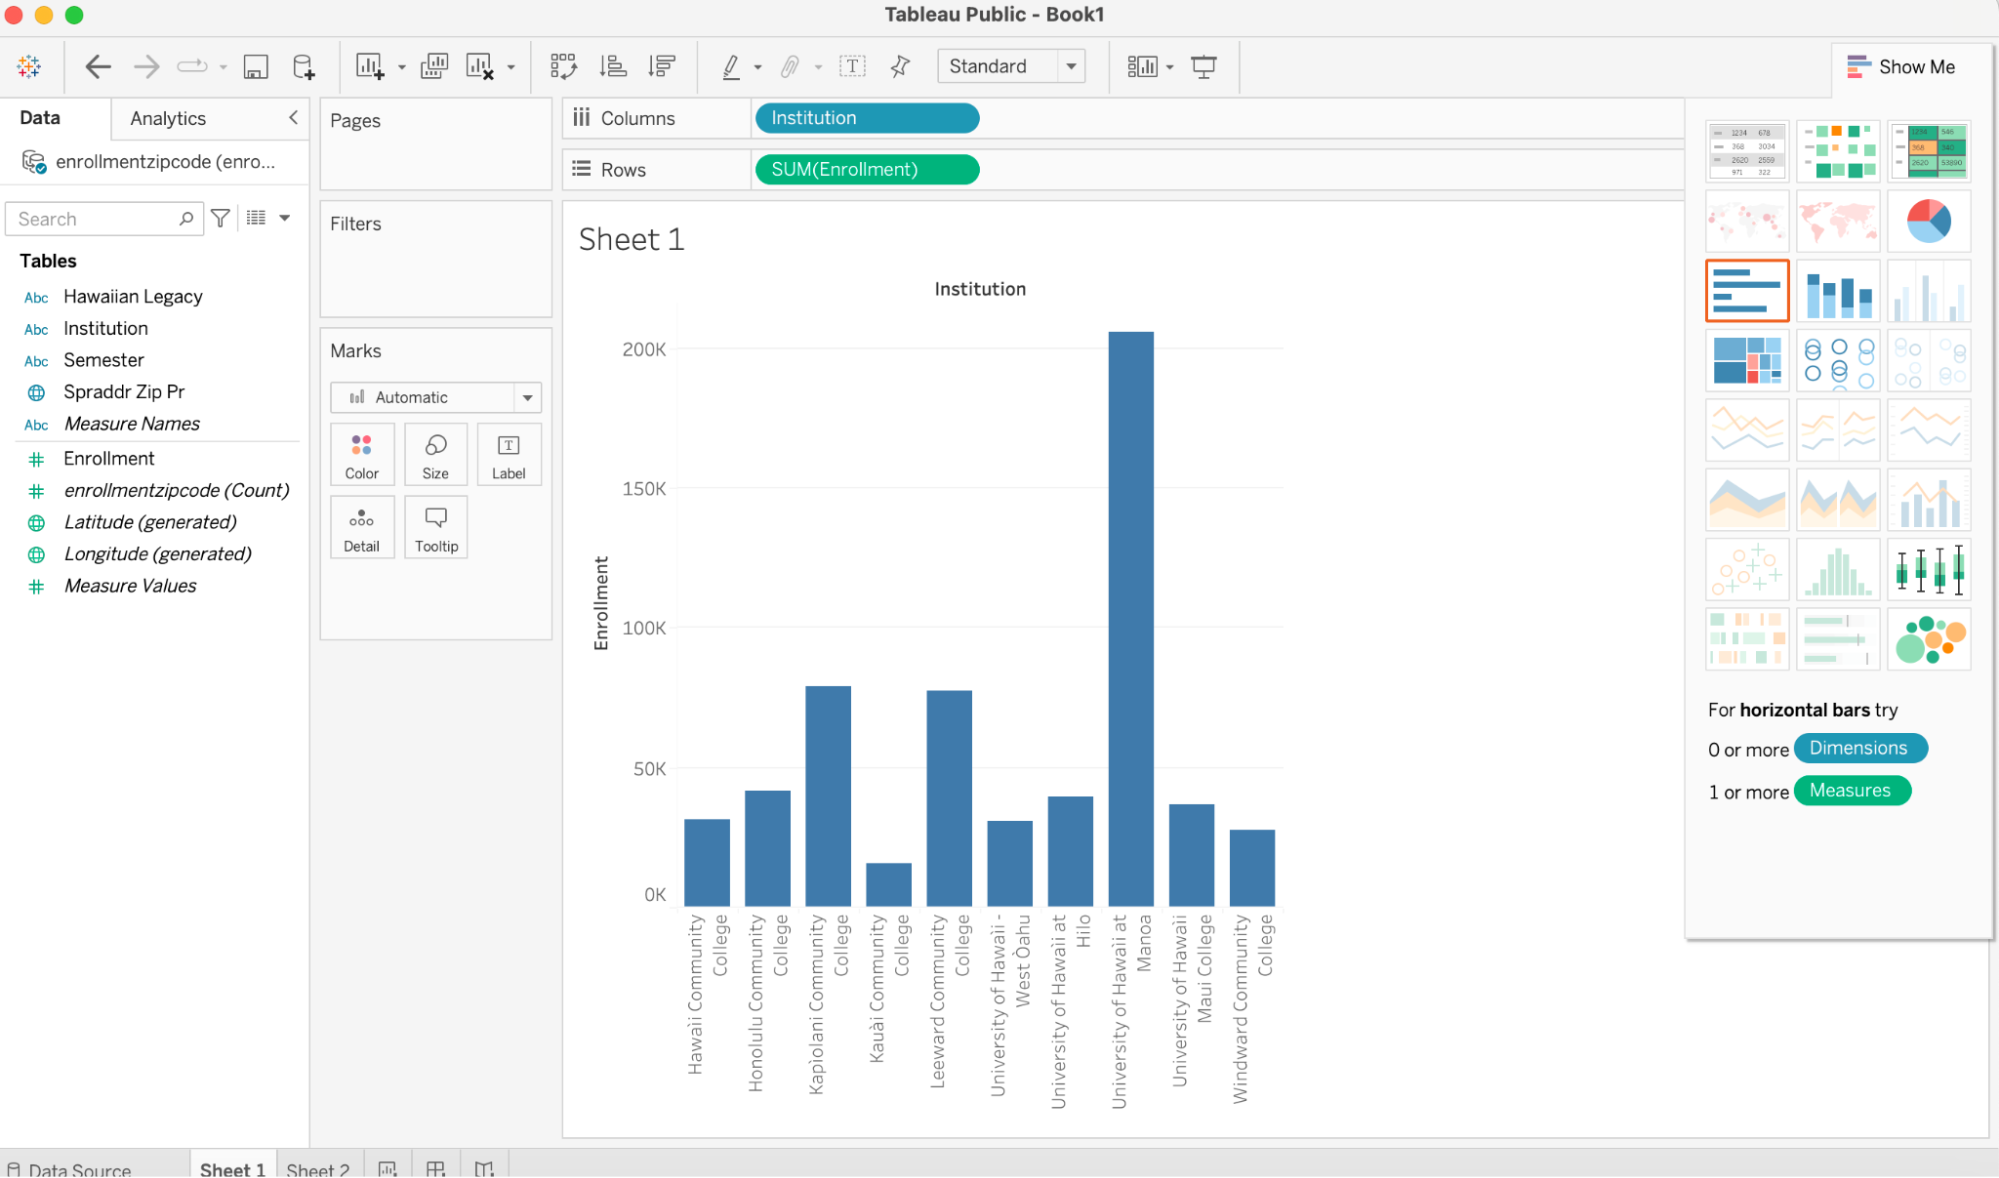
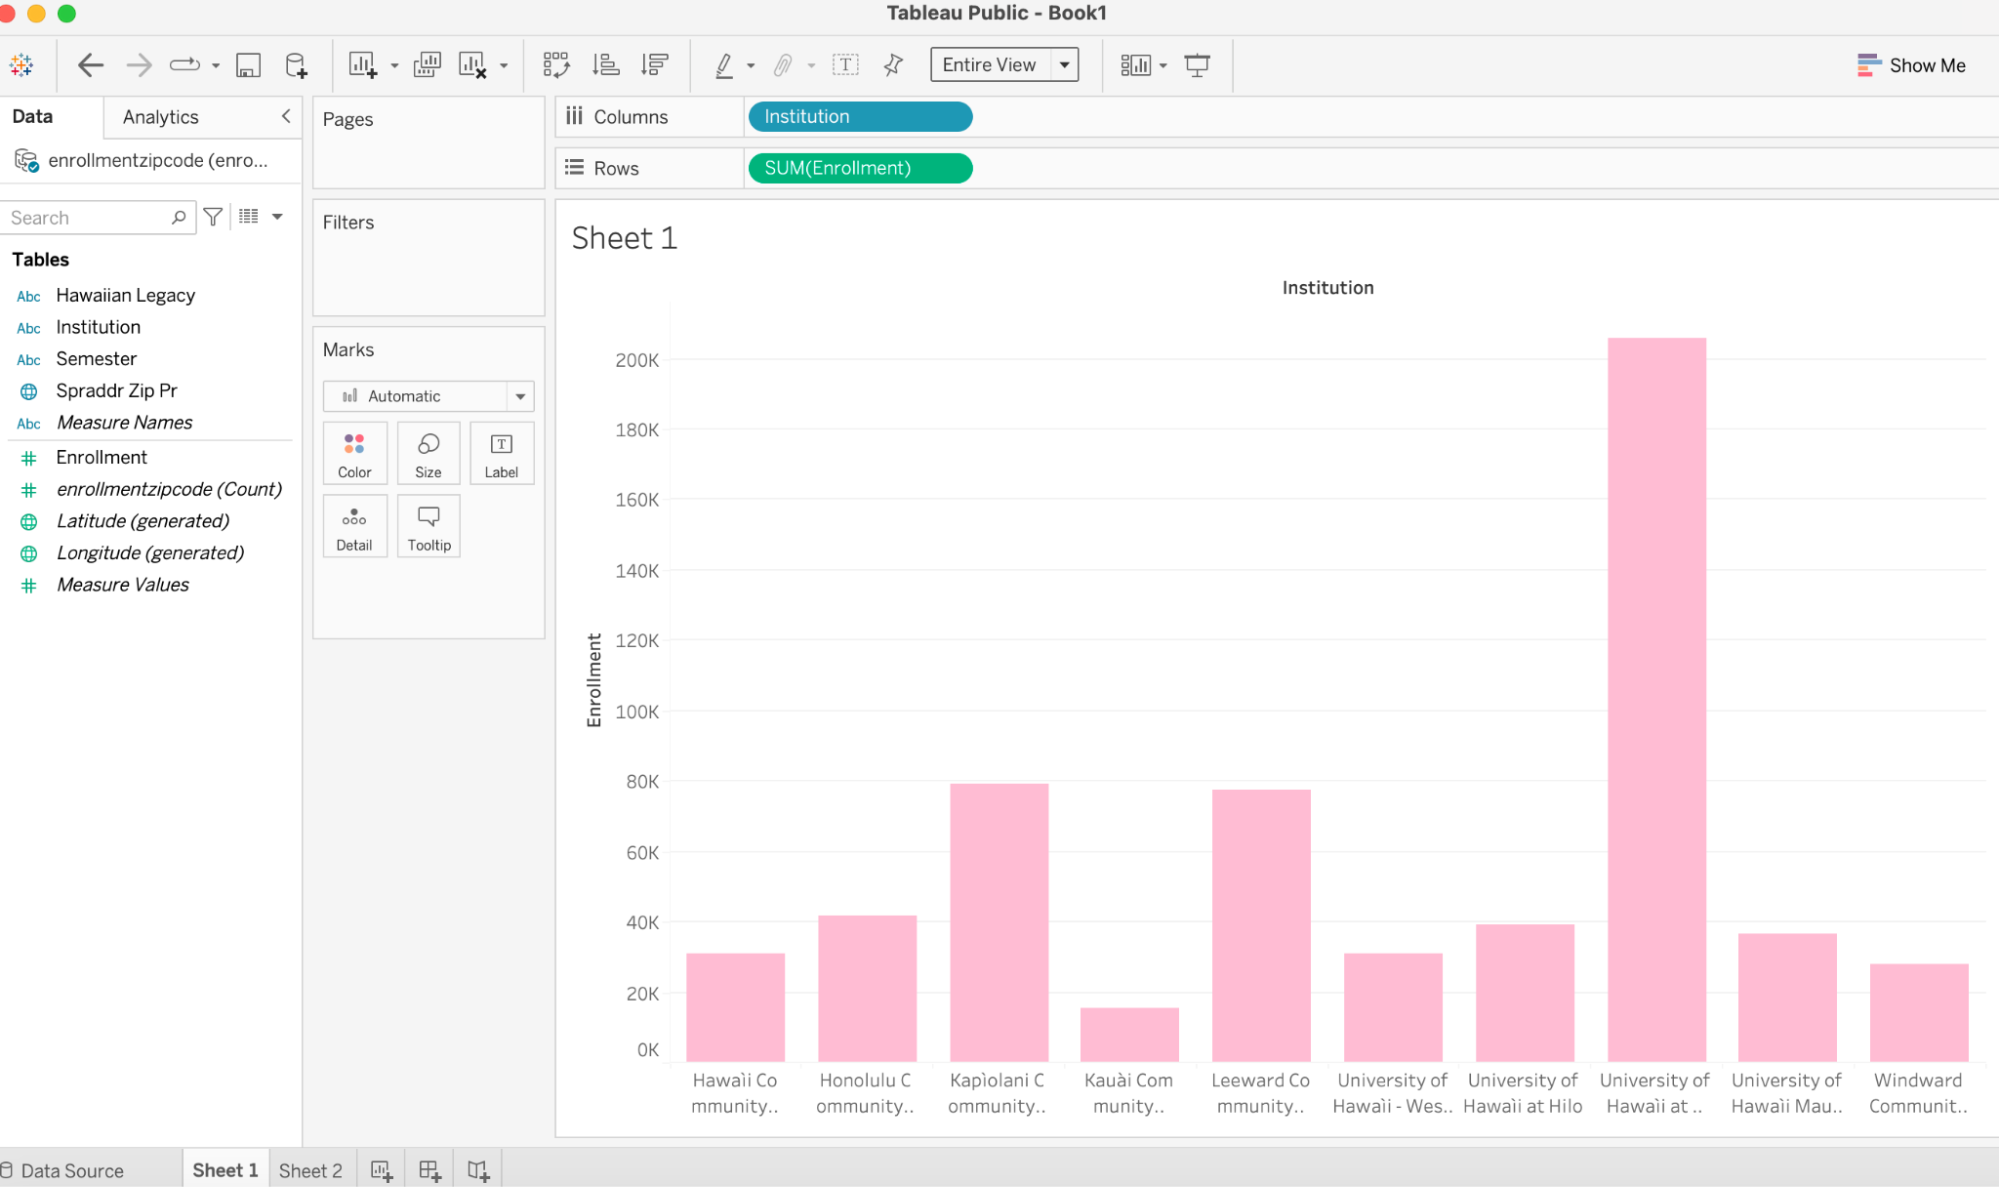
- Your screen should look similar to the screenshot above. To make your figure larger on your screen, click the drop down arrow under “Standard” and select “Entire View”
- There are options to further customize and improve your figure.
- Color: Under “Marks” select different color options for the bars.
- There are options to further customize and improve your figure.
- Size: You can also toggle the size of the bars on the figure to your preference under the “Size” button
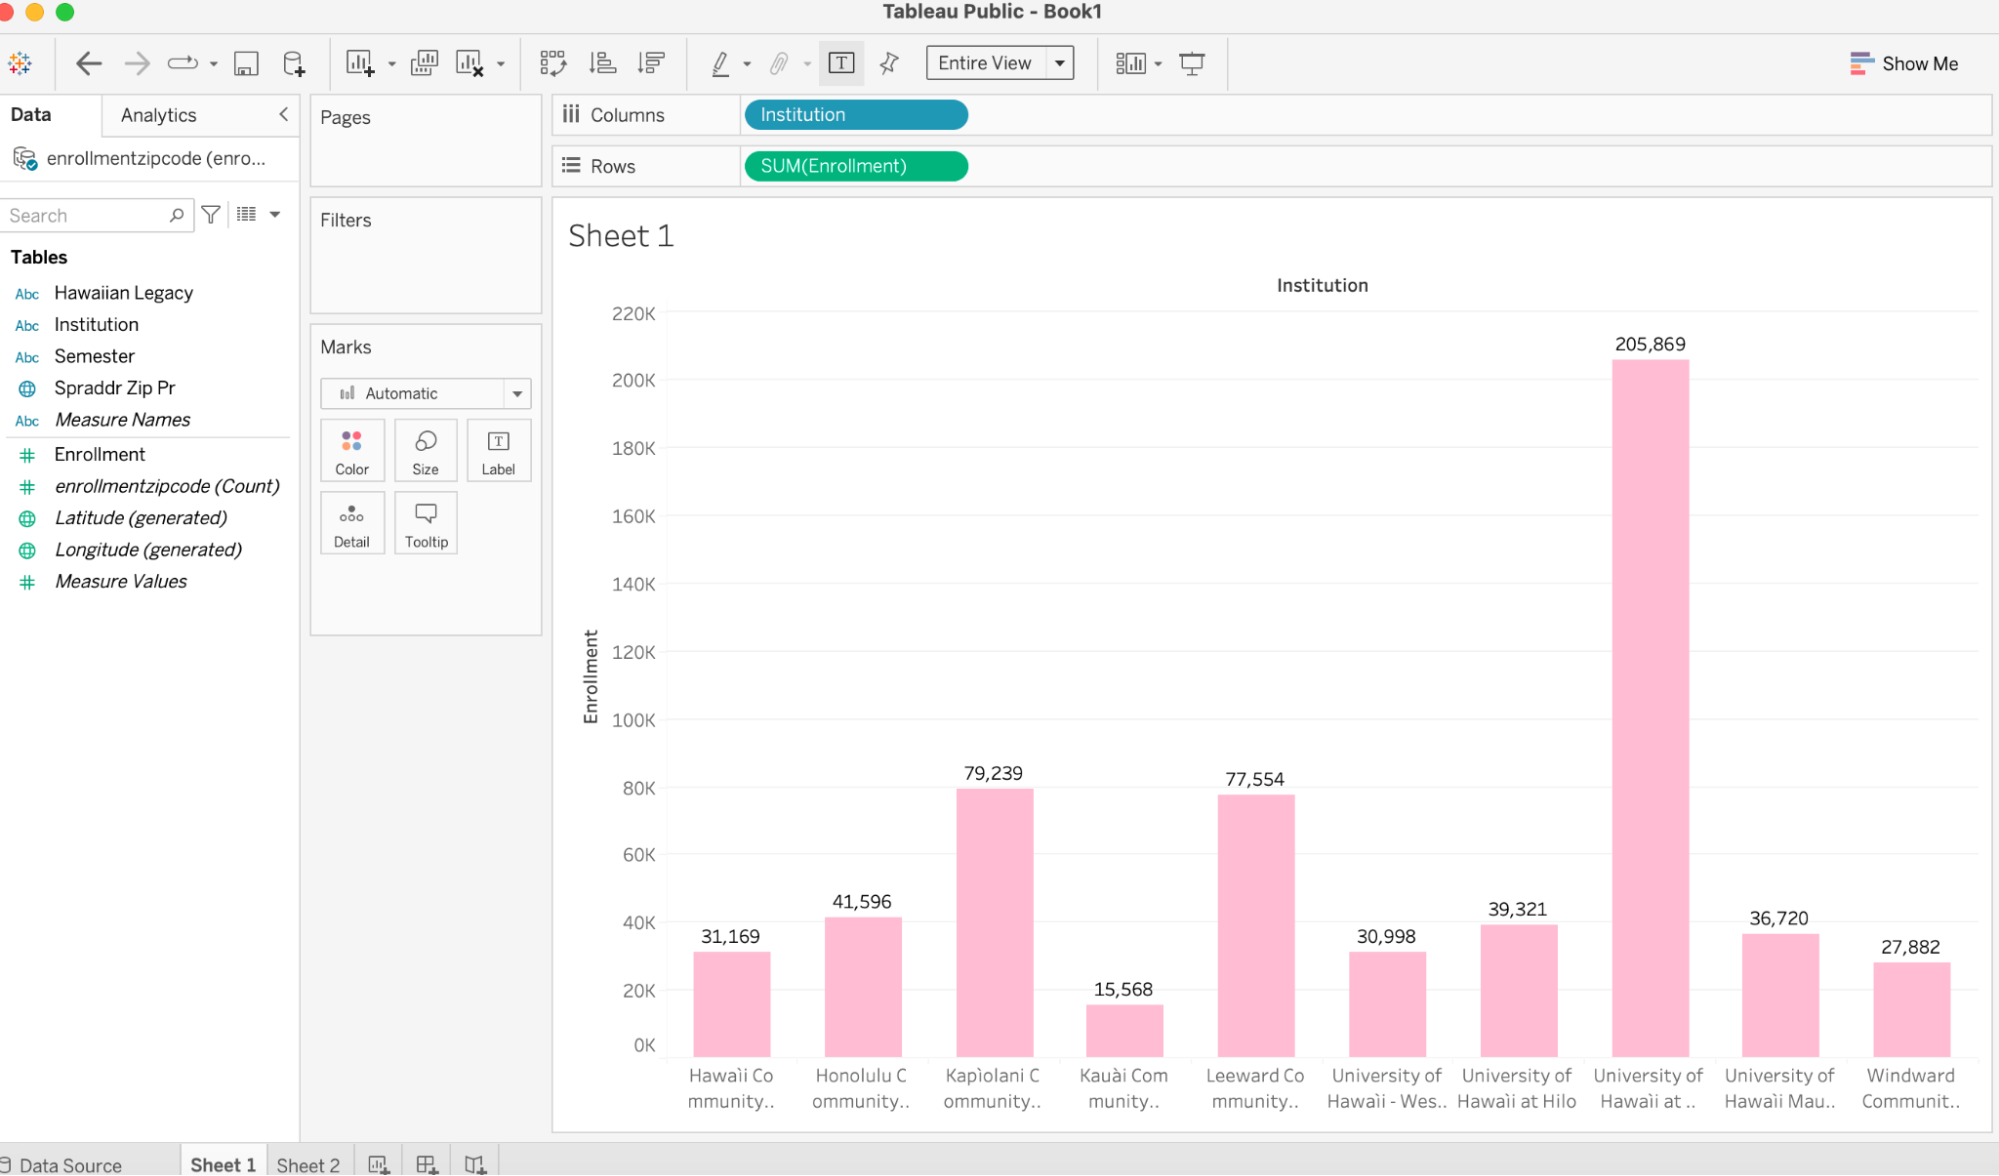
- Labels: You can also display mark labels on each of your bars by selecting “Labels” and then checking the box for “Show mark labels” This shows specific data for each institution.
- Tooltip: you can edit the tooltip displays by clicking “Tooltip” and can change font, font size, alignment and other aspects that you wish to be shown when hovering over each bar.
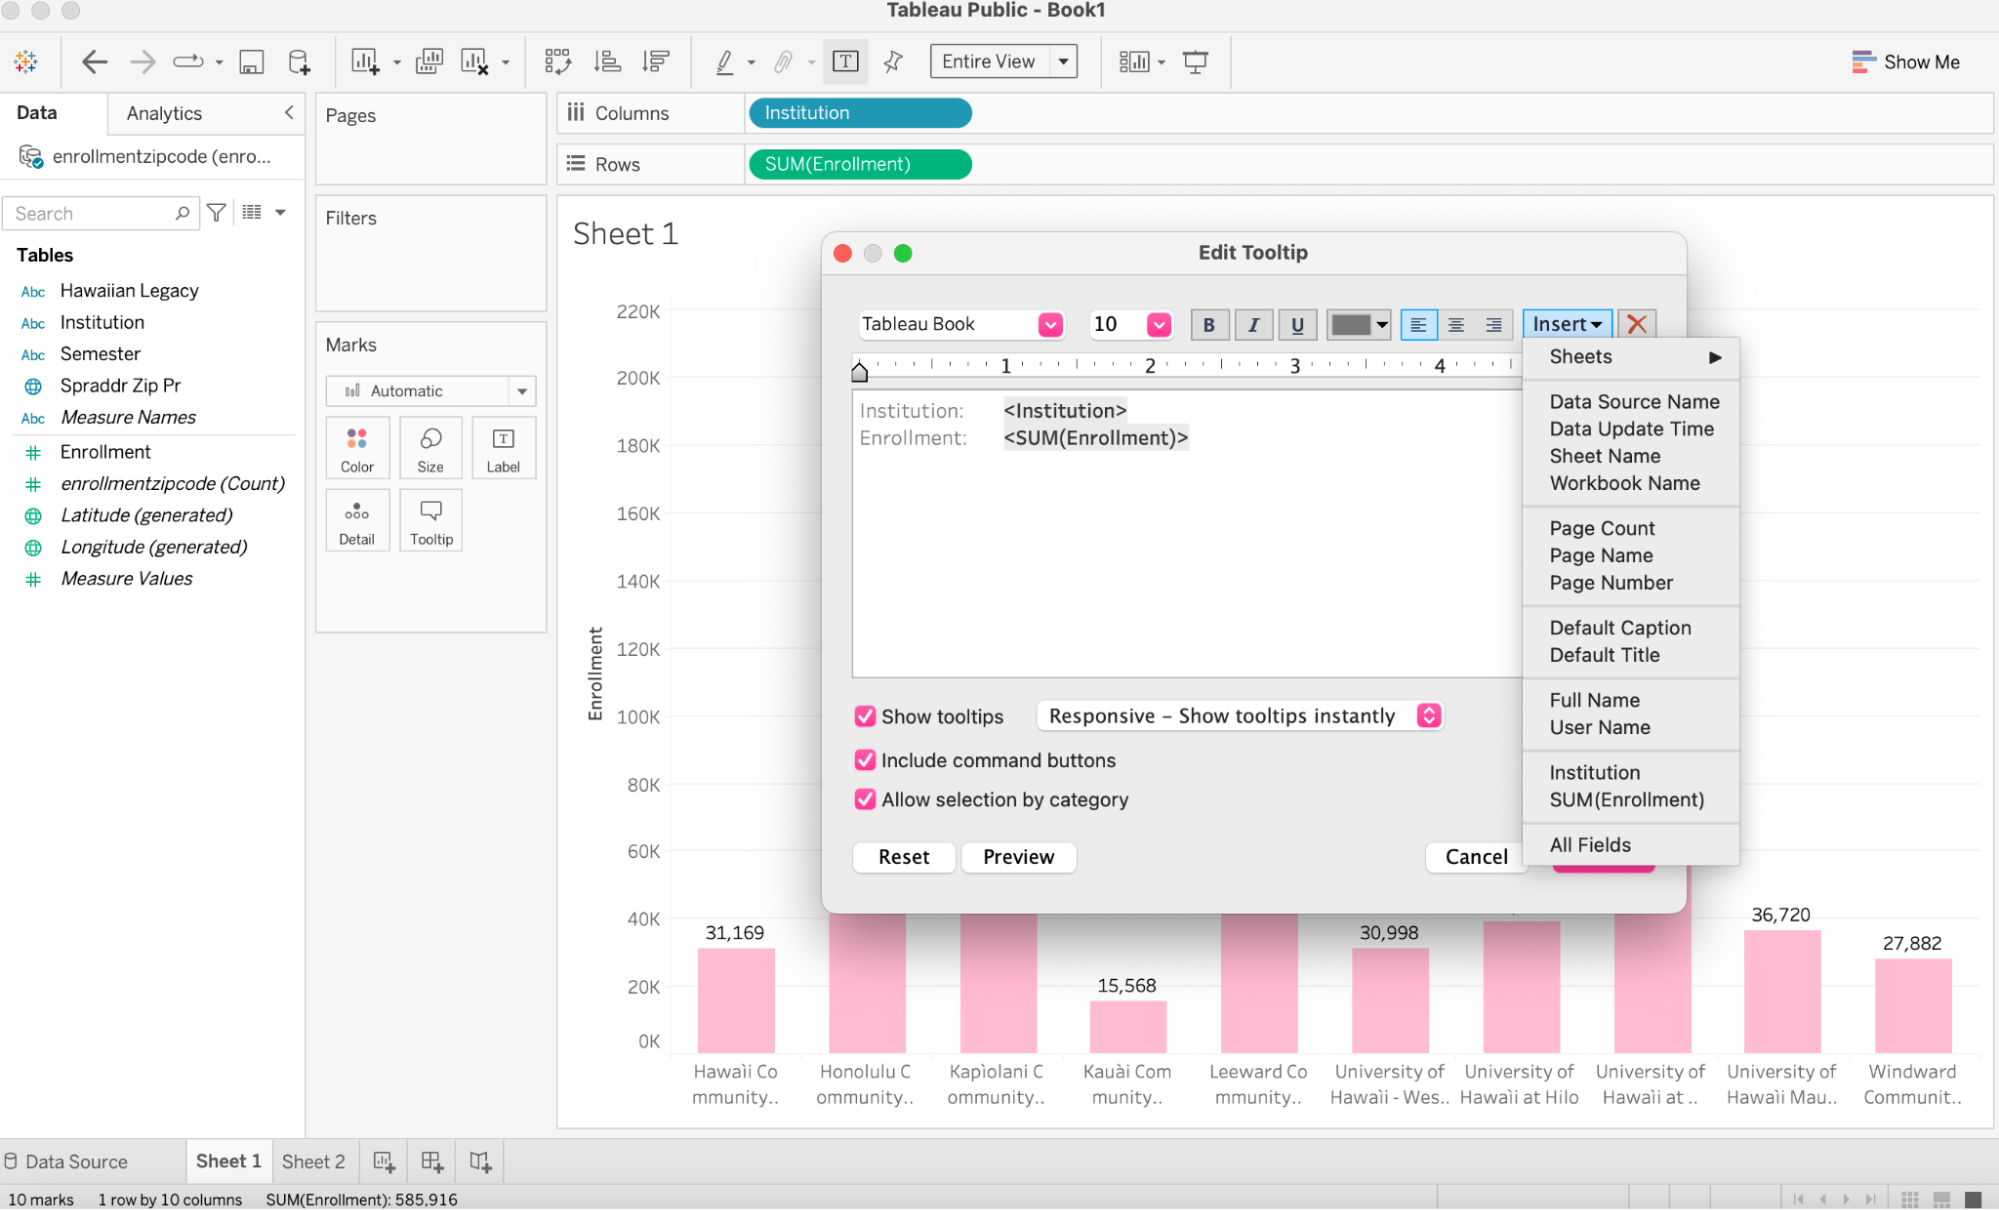
- Tooltip is open above.
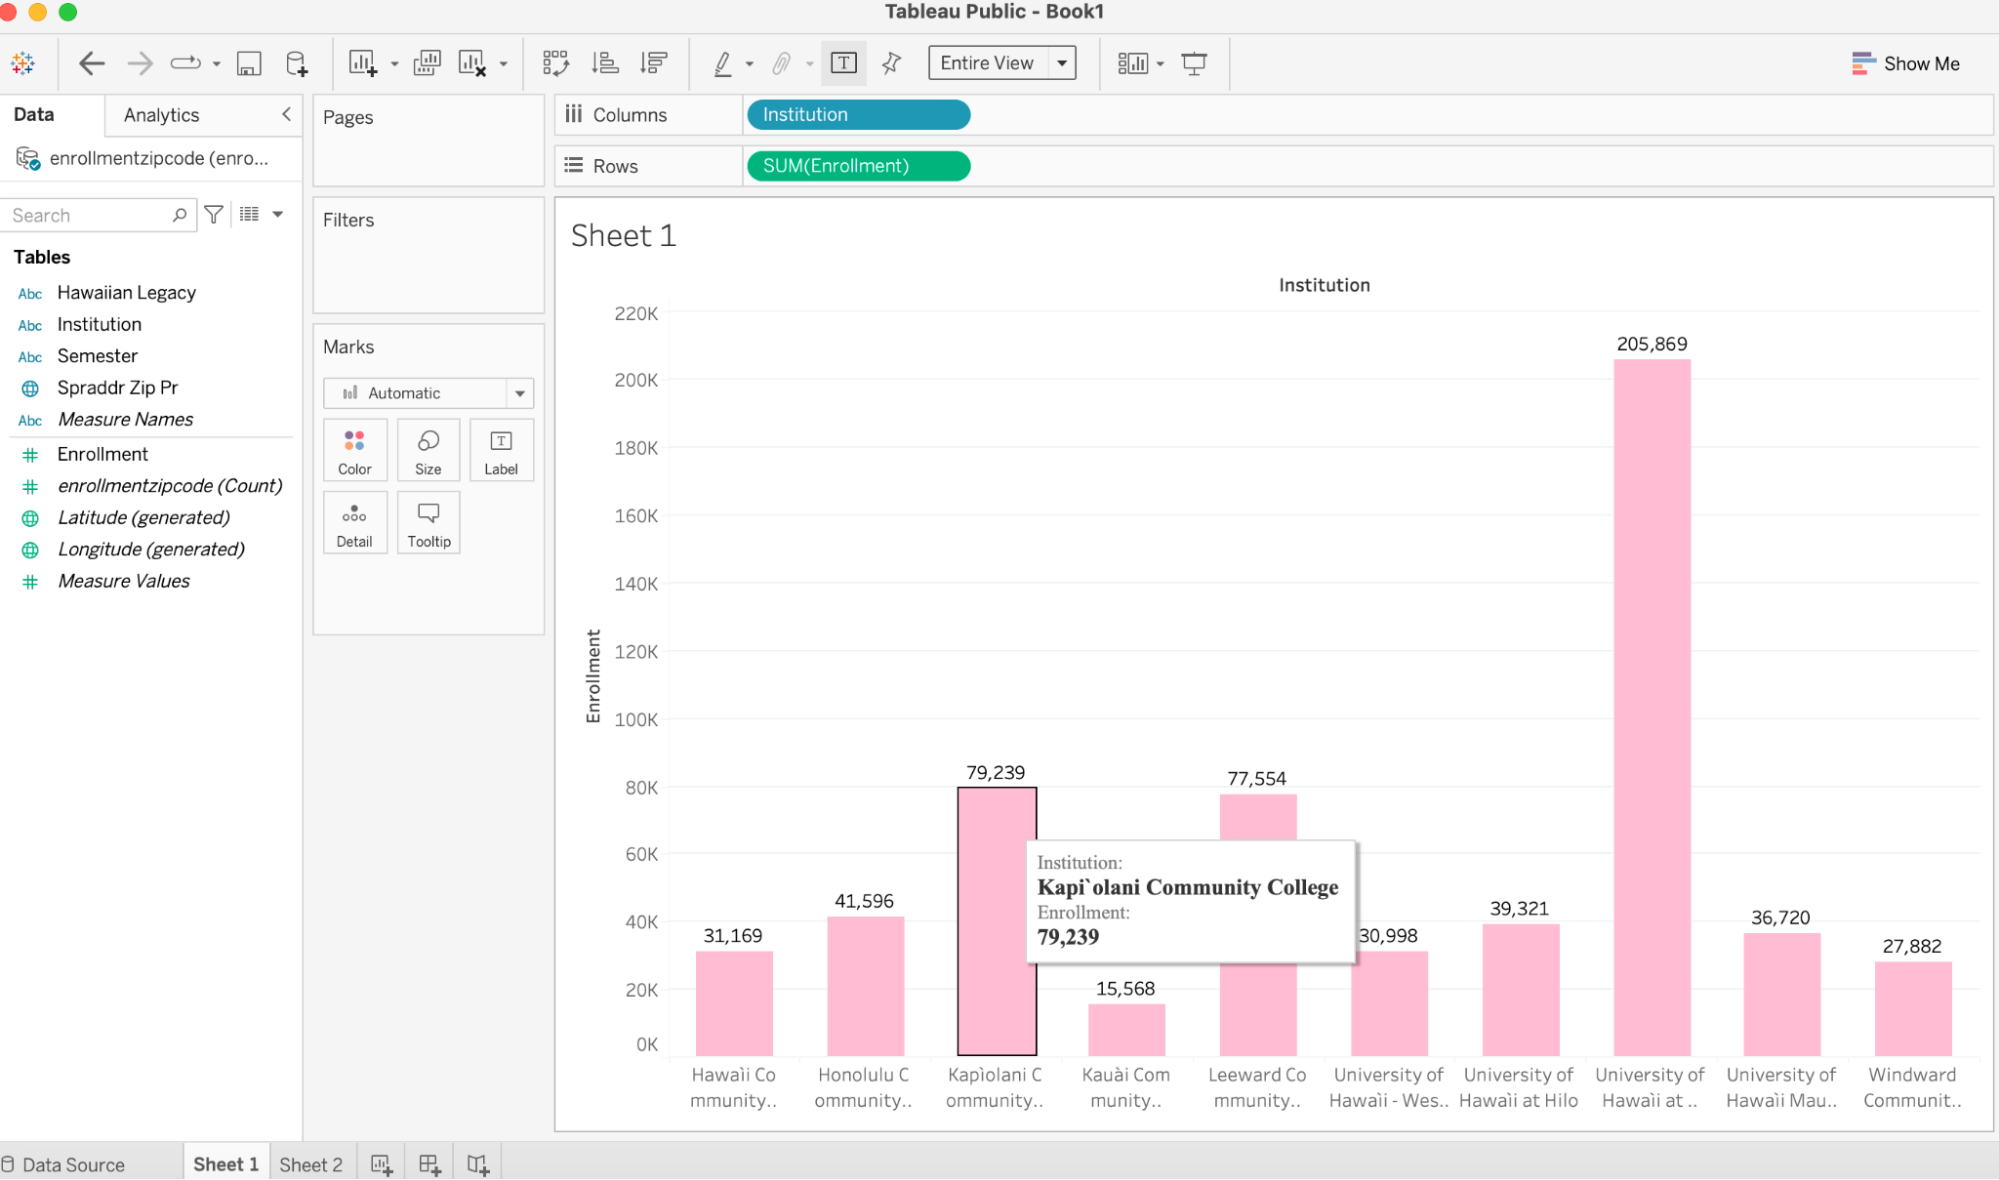
- I have changed the tooltip to be a different text arrangement and made each institution name and enrollment data a bigger font size to be more legible.
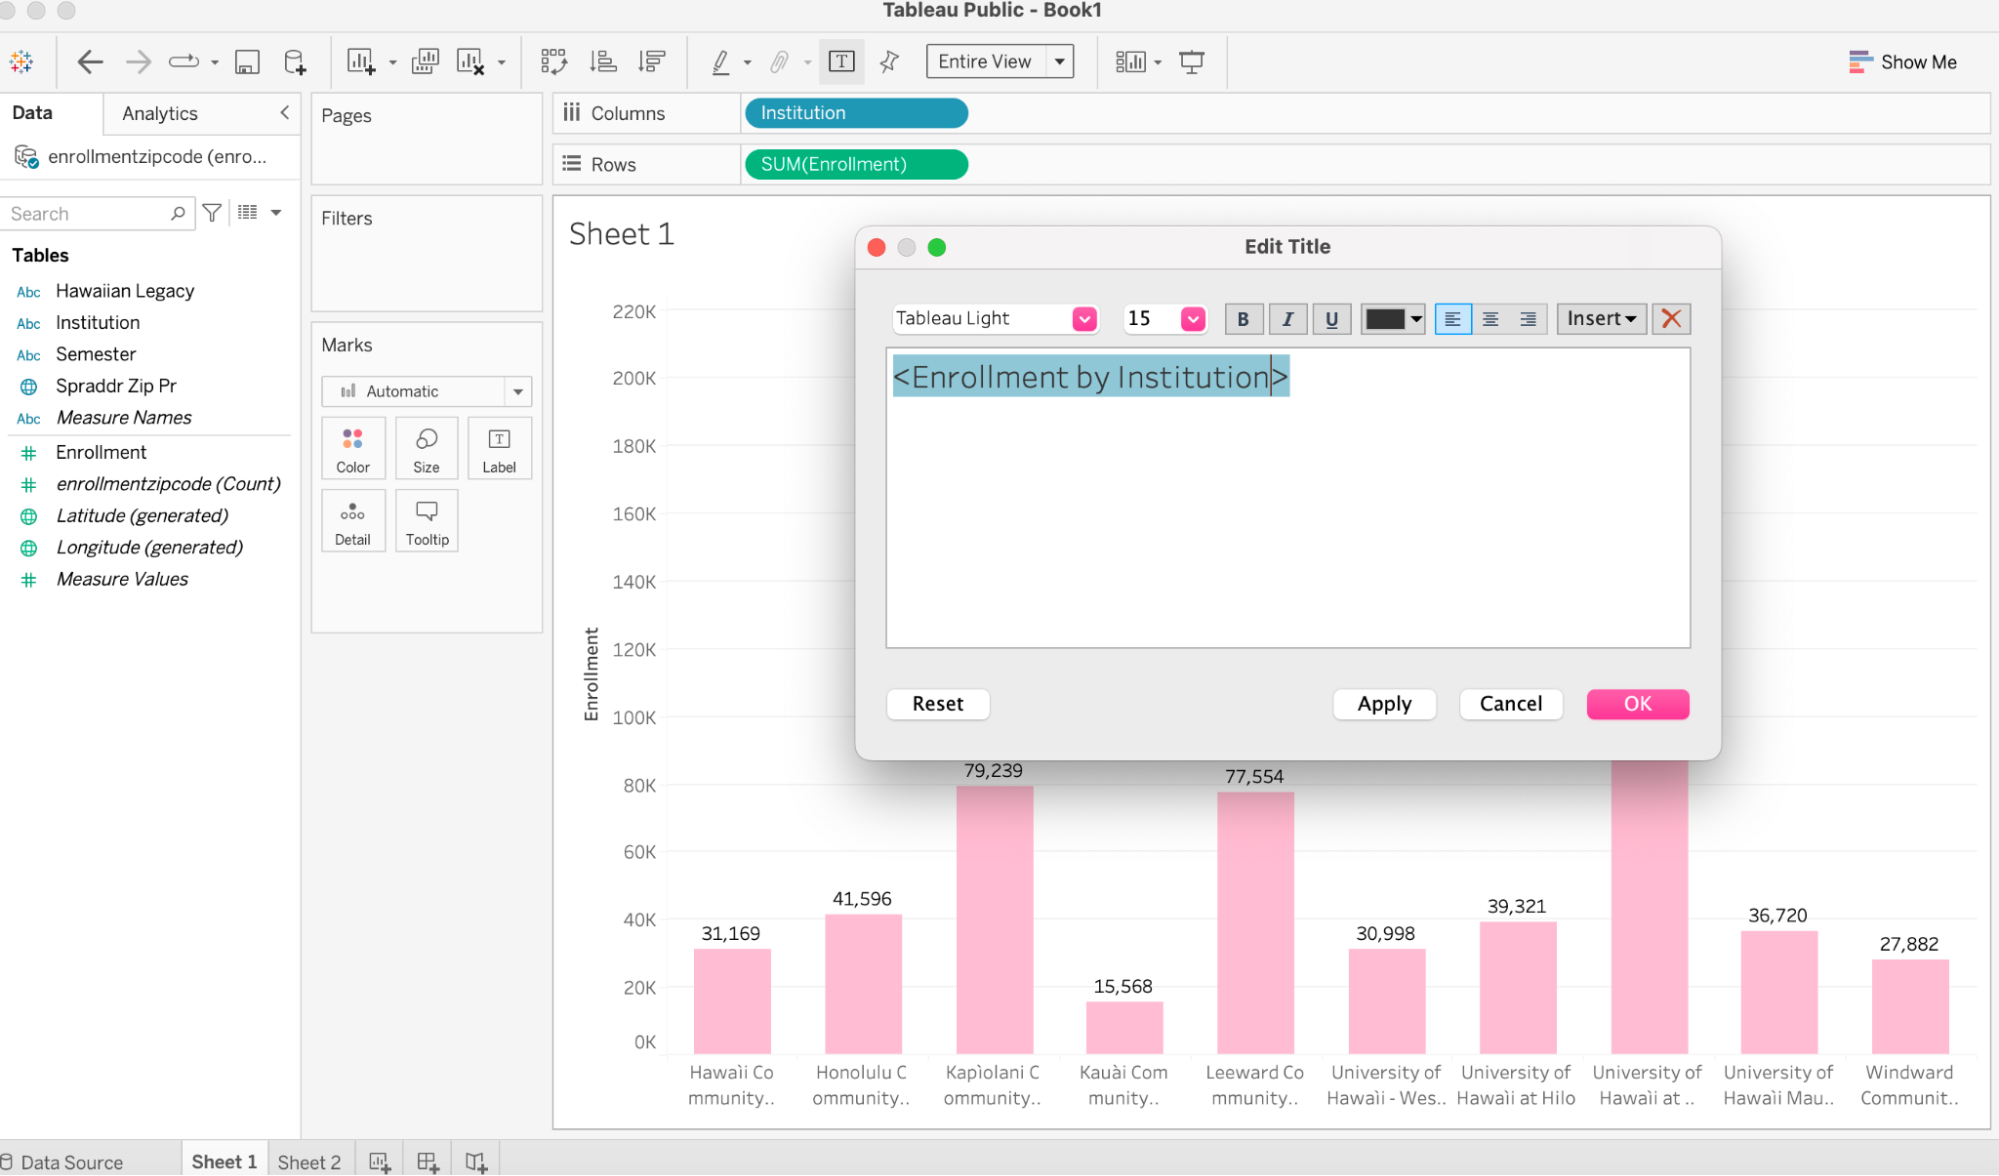
- Title: You can also change the title of the figure by double clicking the title that has a window pop up and is able to be edited similarly to the tooltips.
- You can also save and publish your final figure to Tableau public
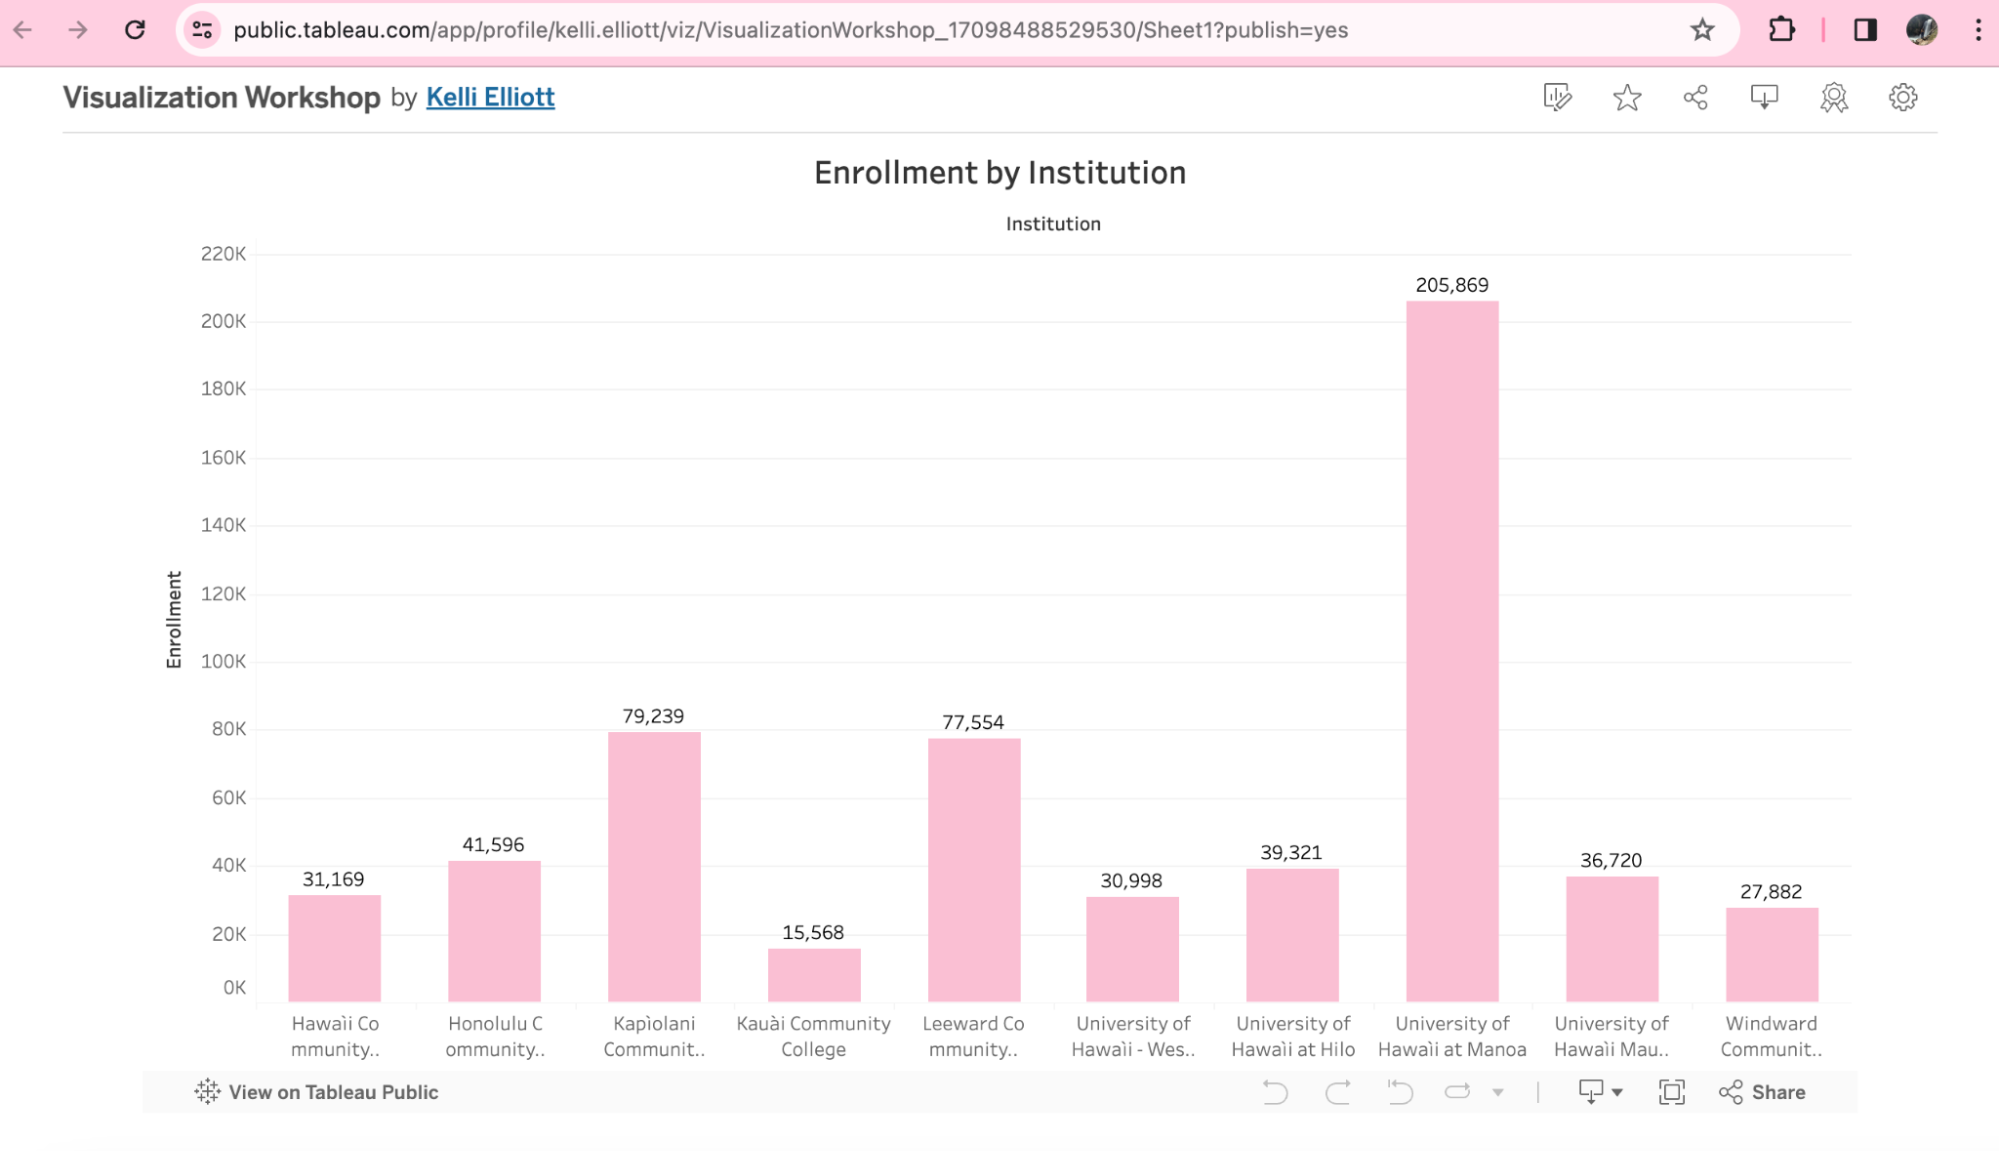
-
Finally, you can download your graph as a number of different options, I chose a PDF and scaled to about 80%.
-
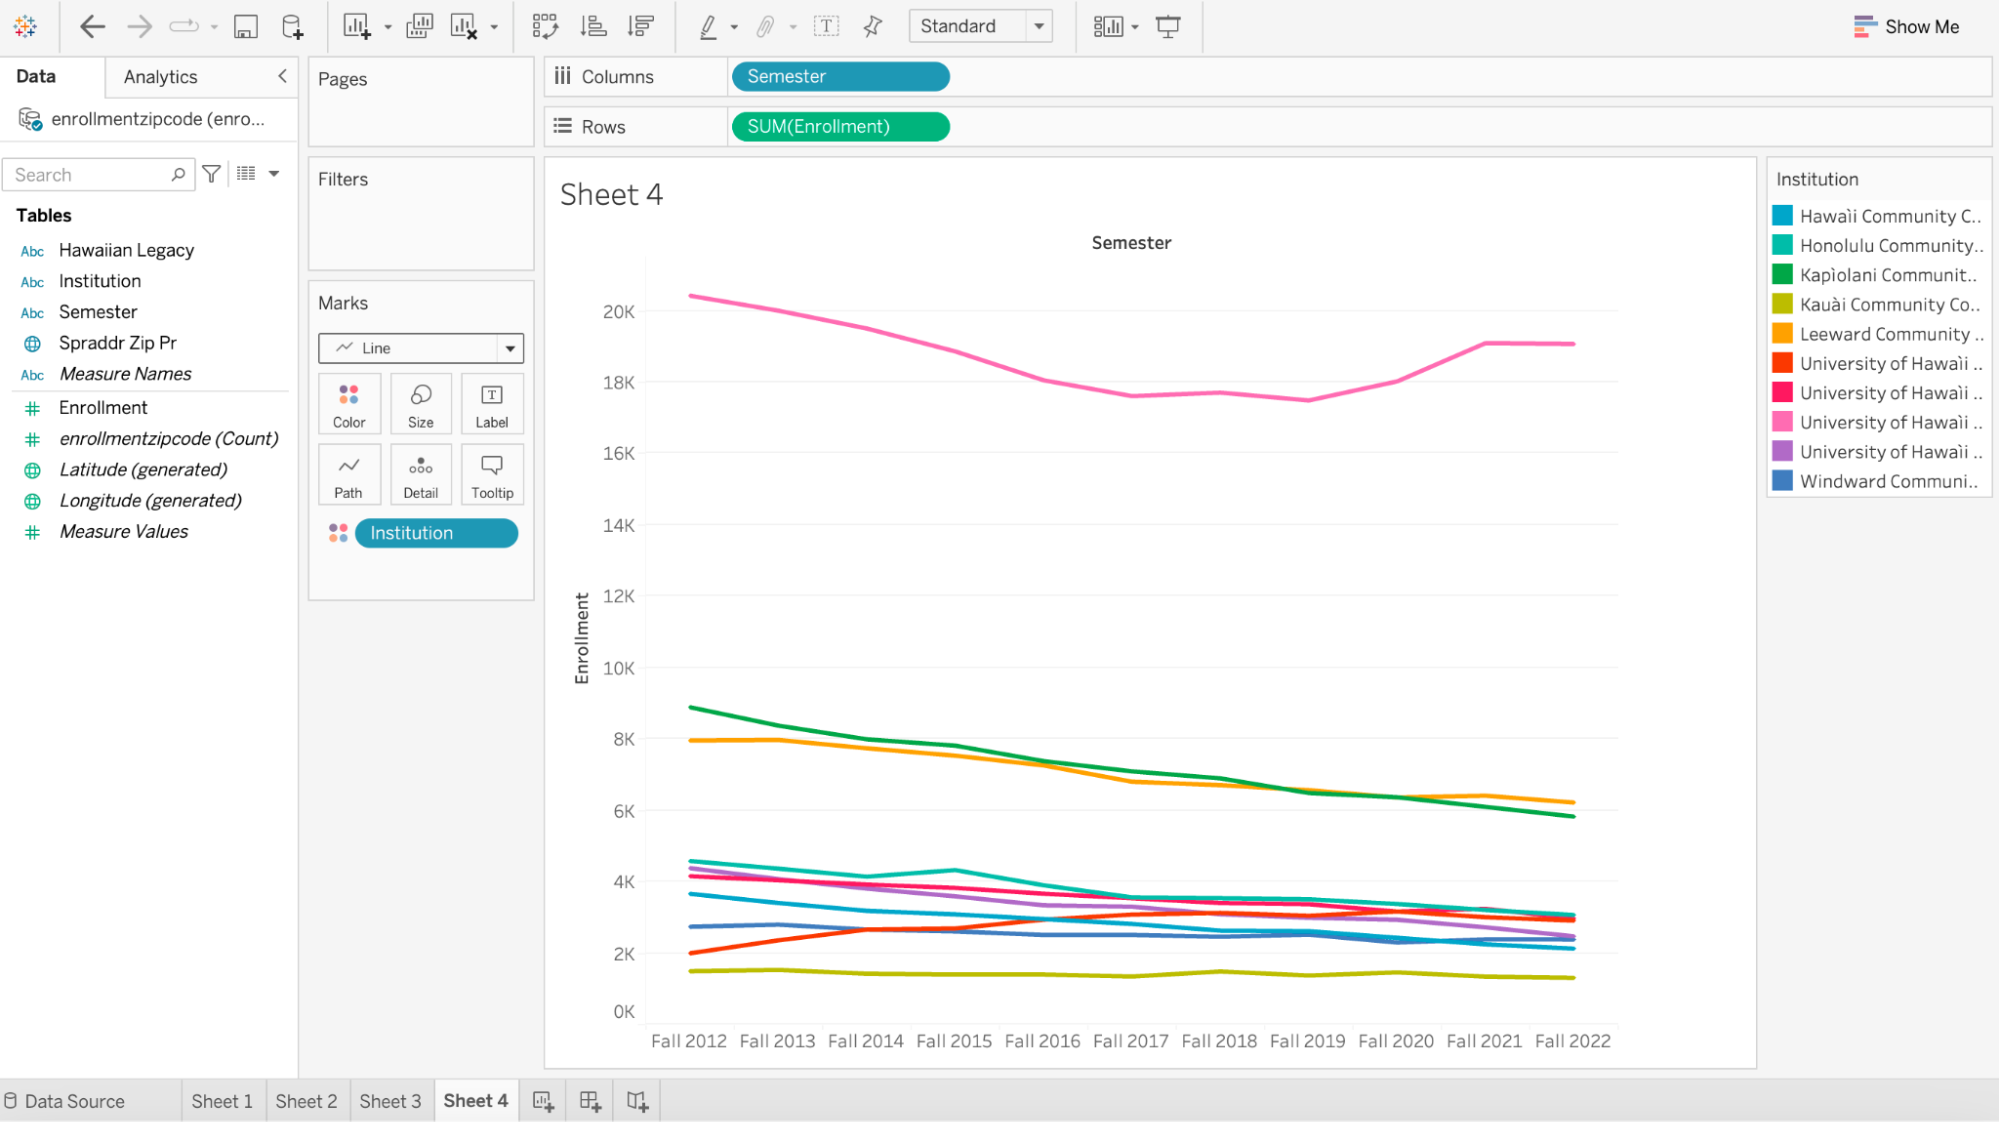
Visualization 2: line graph (x-axis: enrollment, y-axis: institution) institution by semester
- Open sheet 2 to add new figure
- Drag institution and semester to columns and then enrollment to rows at the top of the sheet. Choose “Line” in the marks. It shows you multiple charts. Drag “Institution” from col to under the marks toolbar, it will make them all appear in the same chart (unifies into one chart rather than separate ones), then fix colors by clicking the dots icon next to institution label.
- If you want to compare specific institutions and only display those institutions, that is also possible!
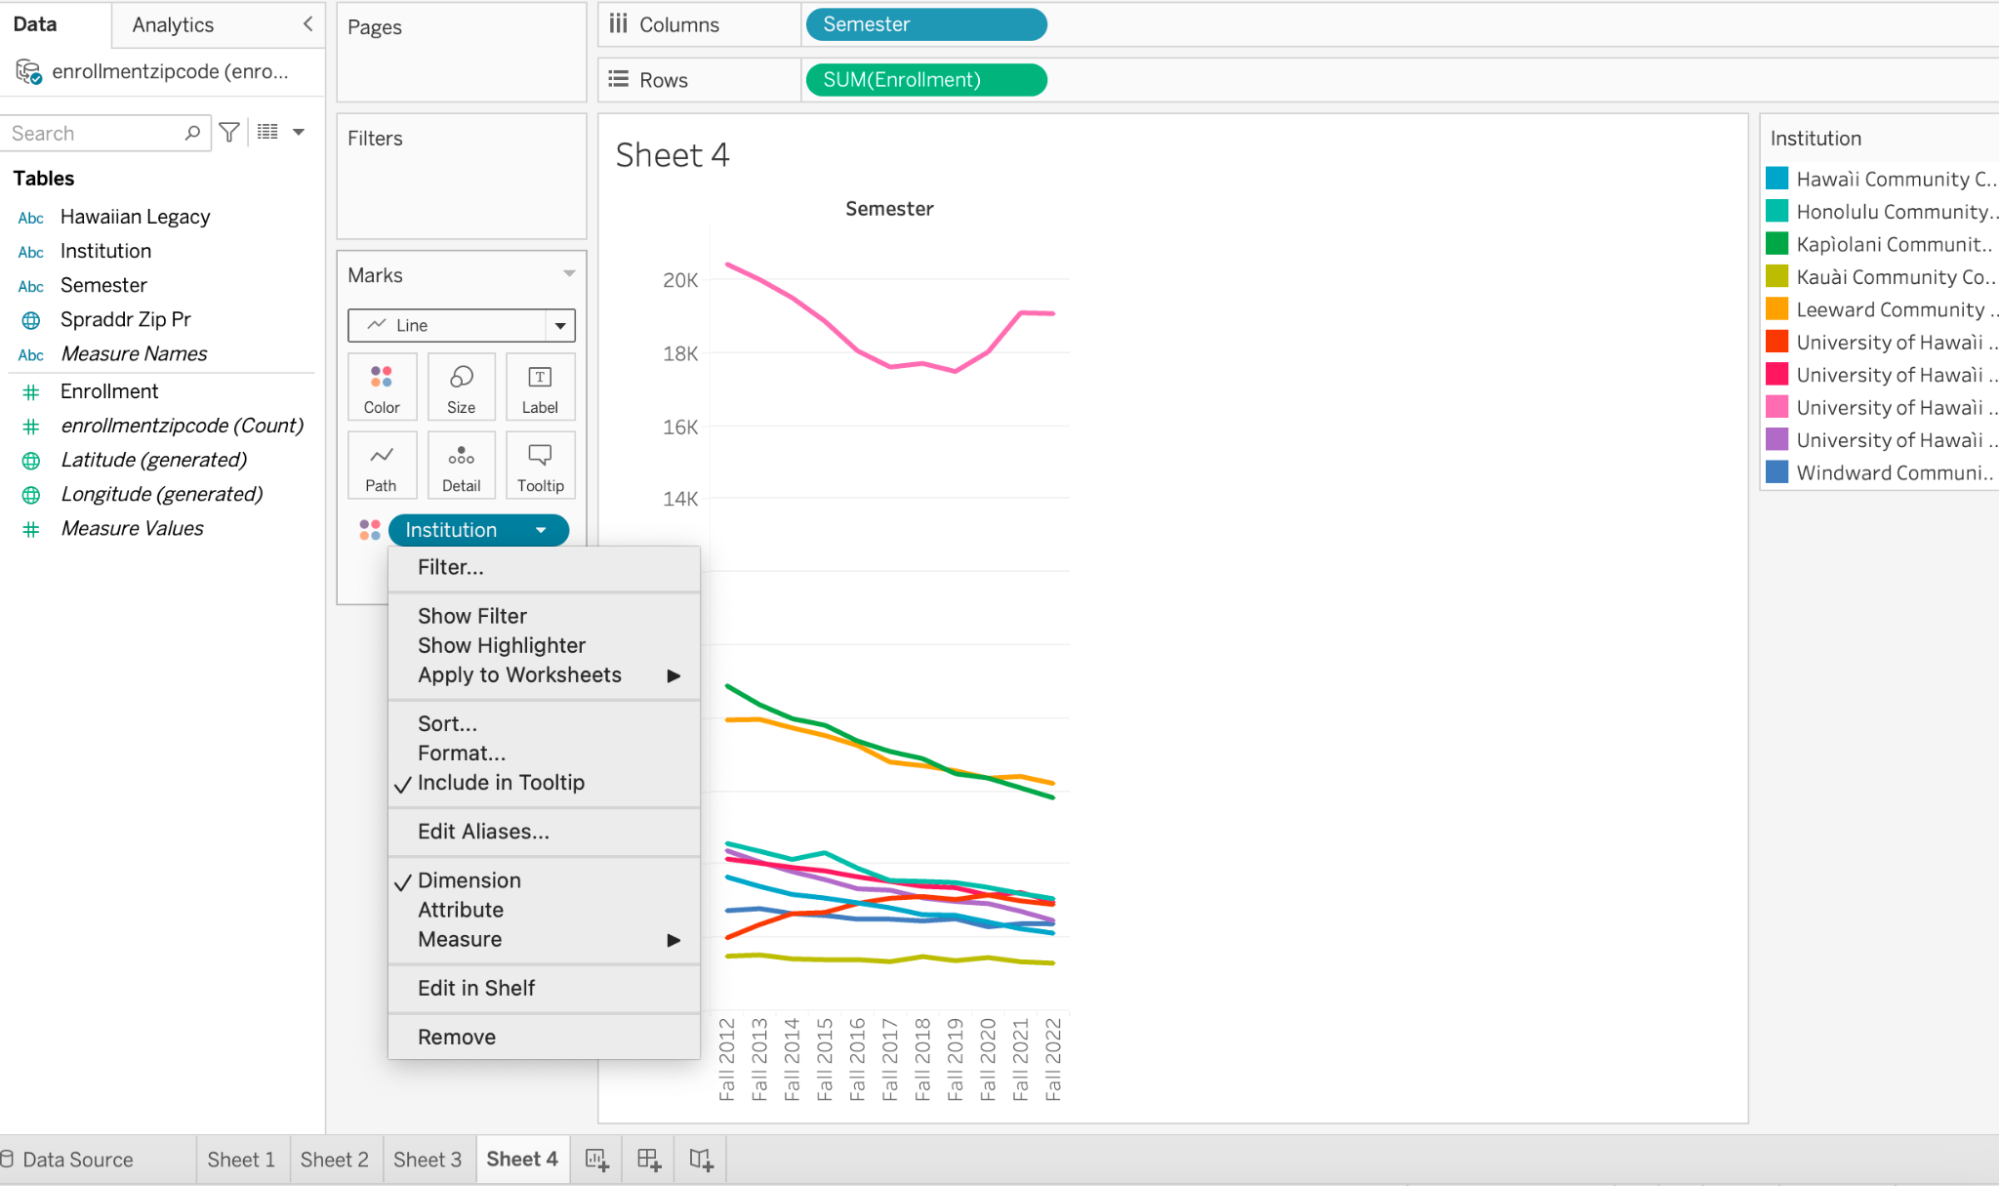
- Click the drop down arrow under “Institution” and then the “Filter” button.
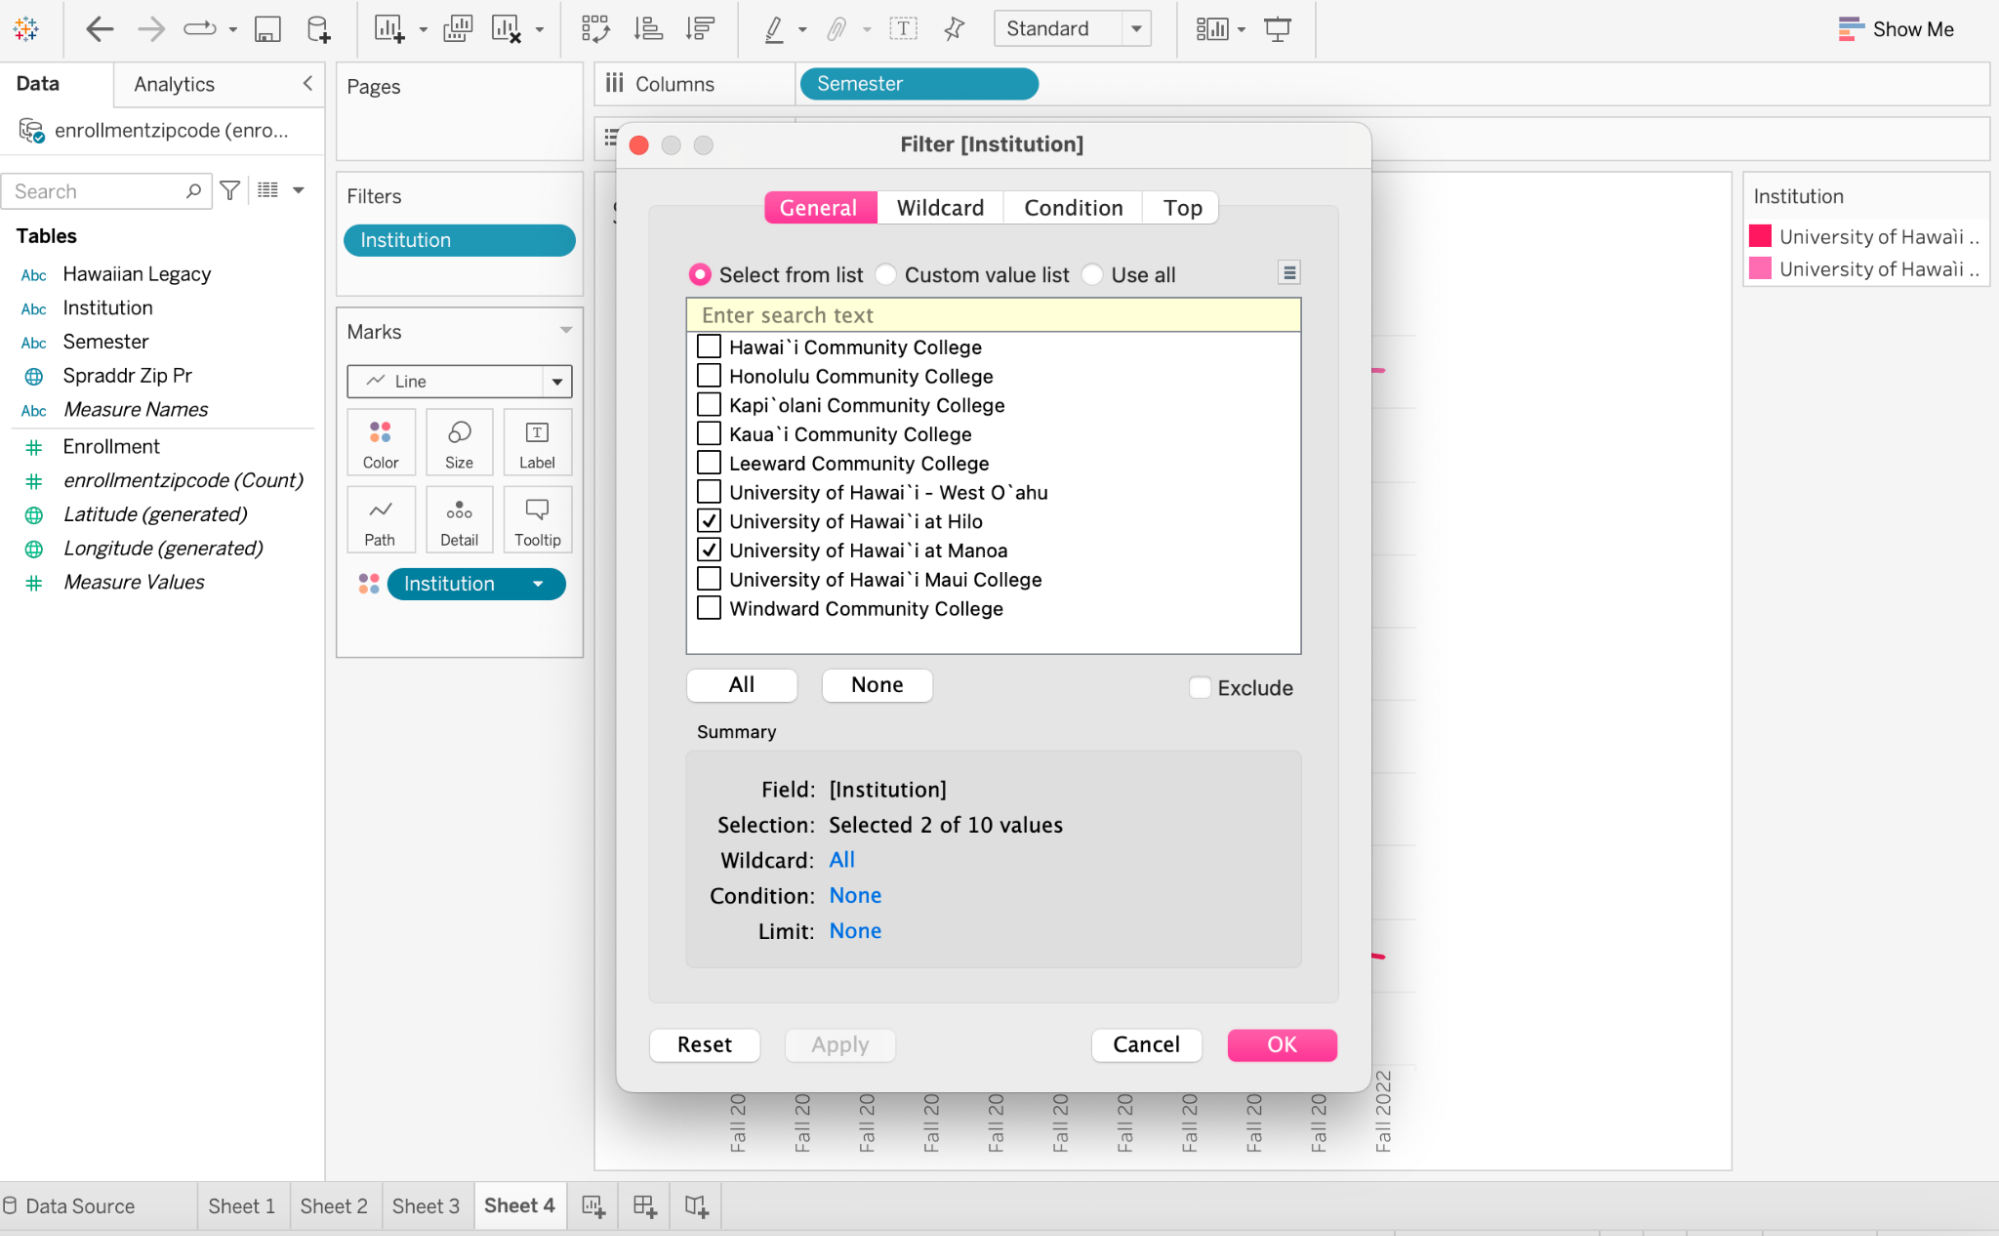
- Select desired institutions- I am comparing Manoa and Hilo. Press OK to display new figure.
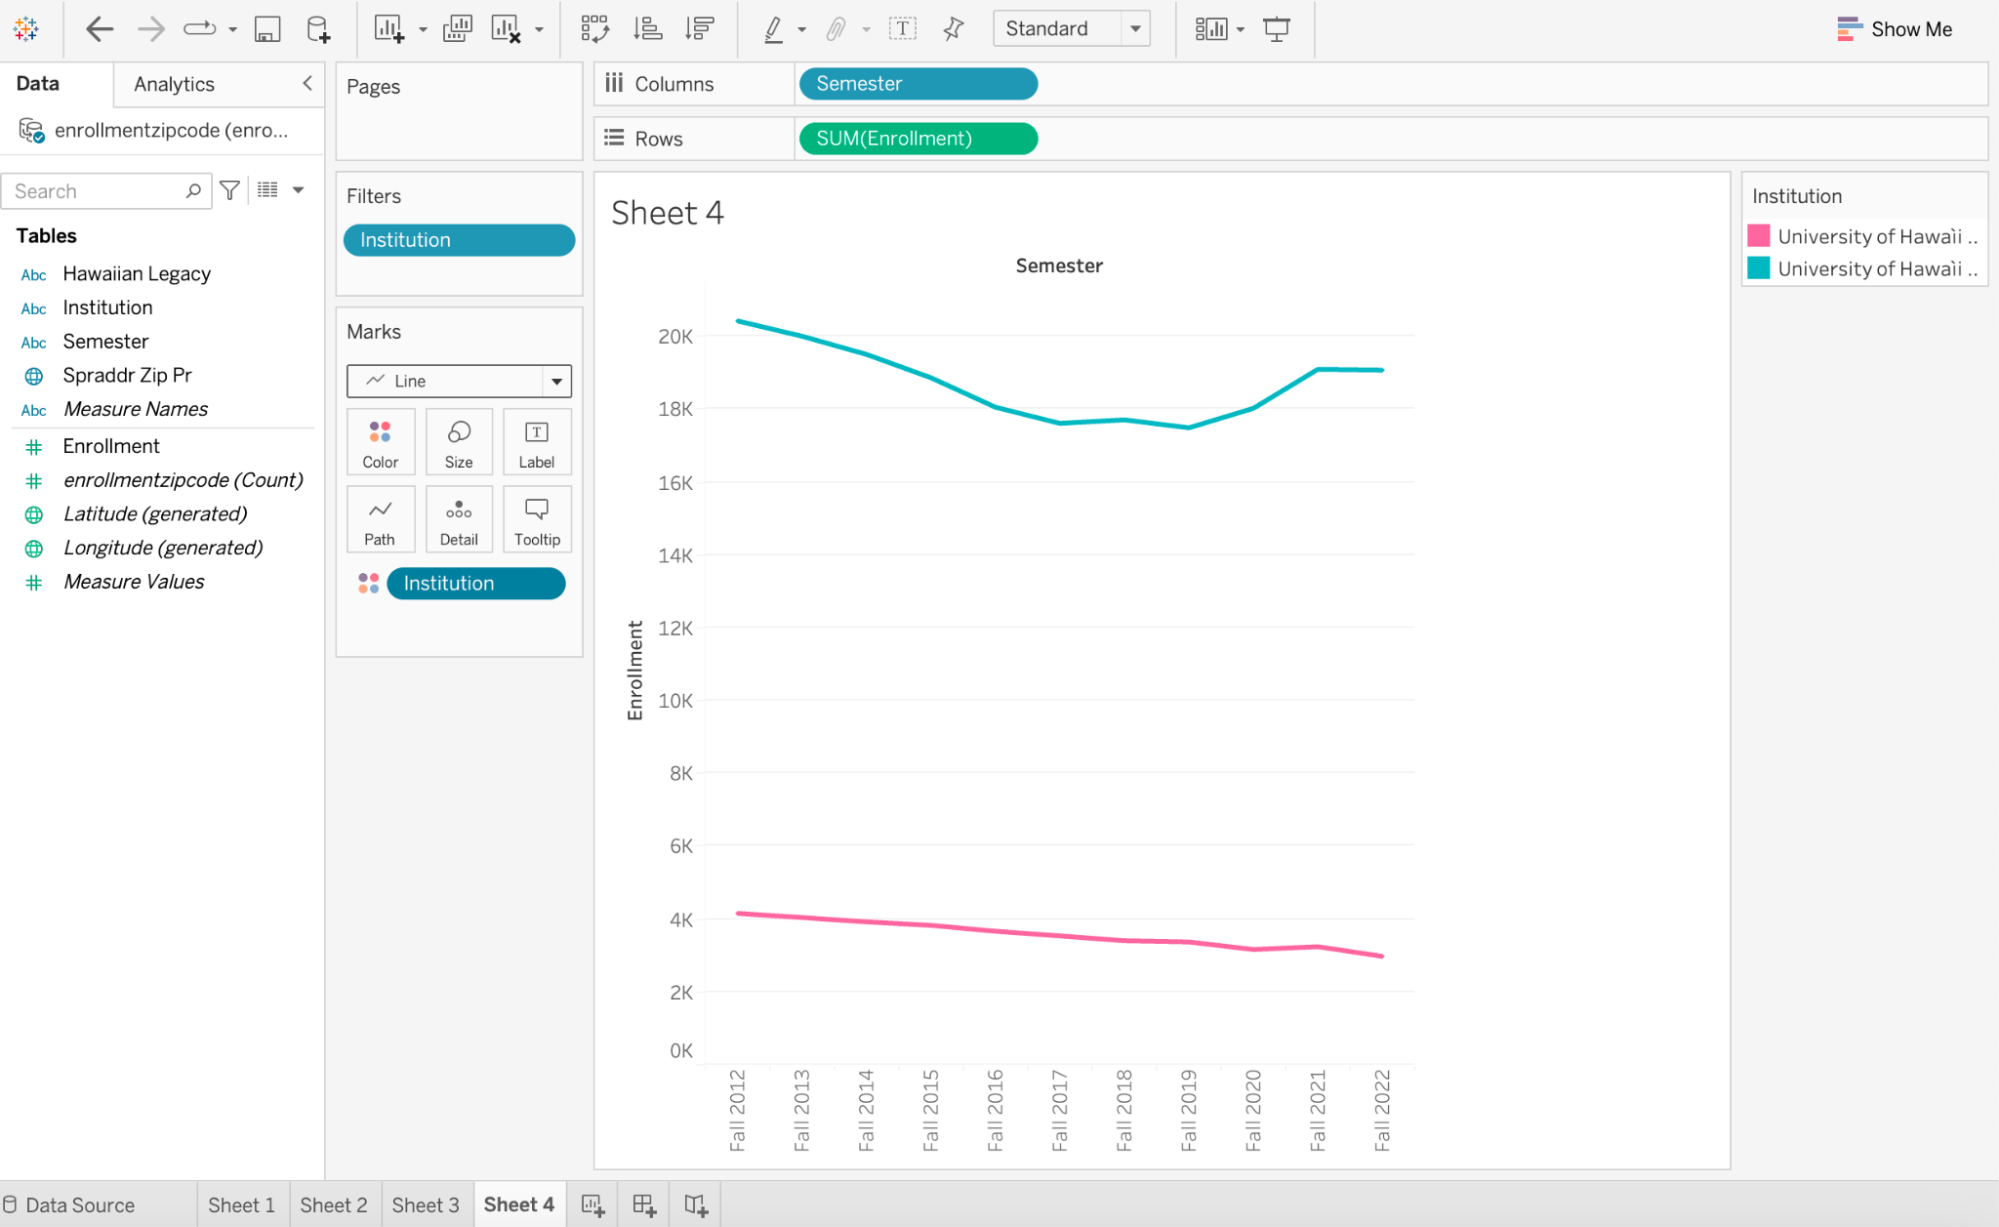
-
Your final figure should look similar to this!
-
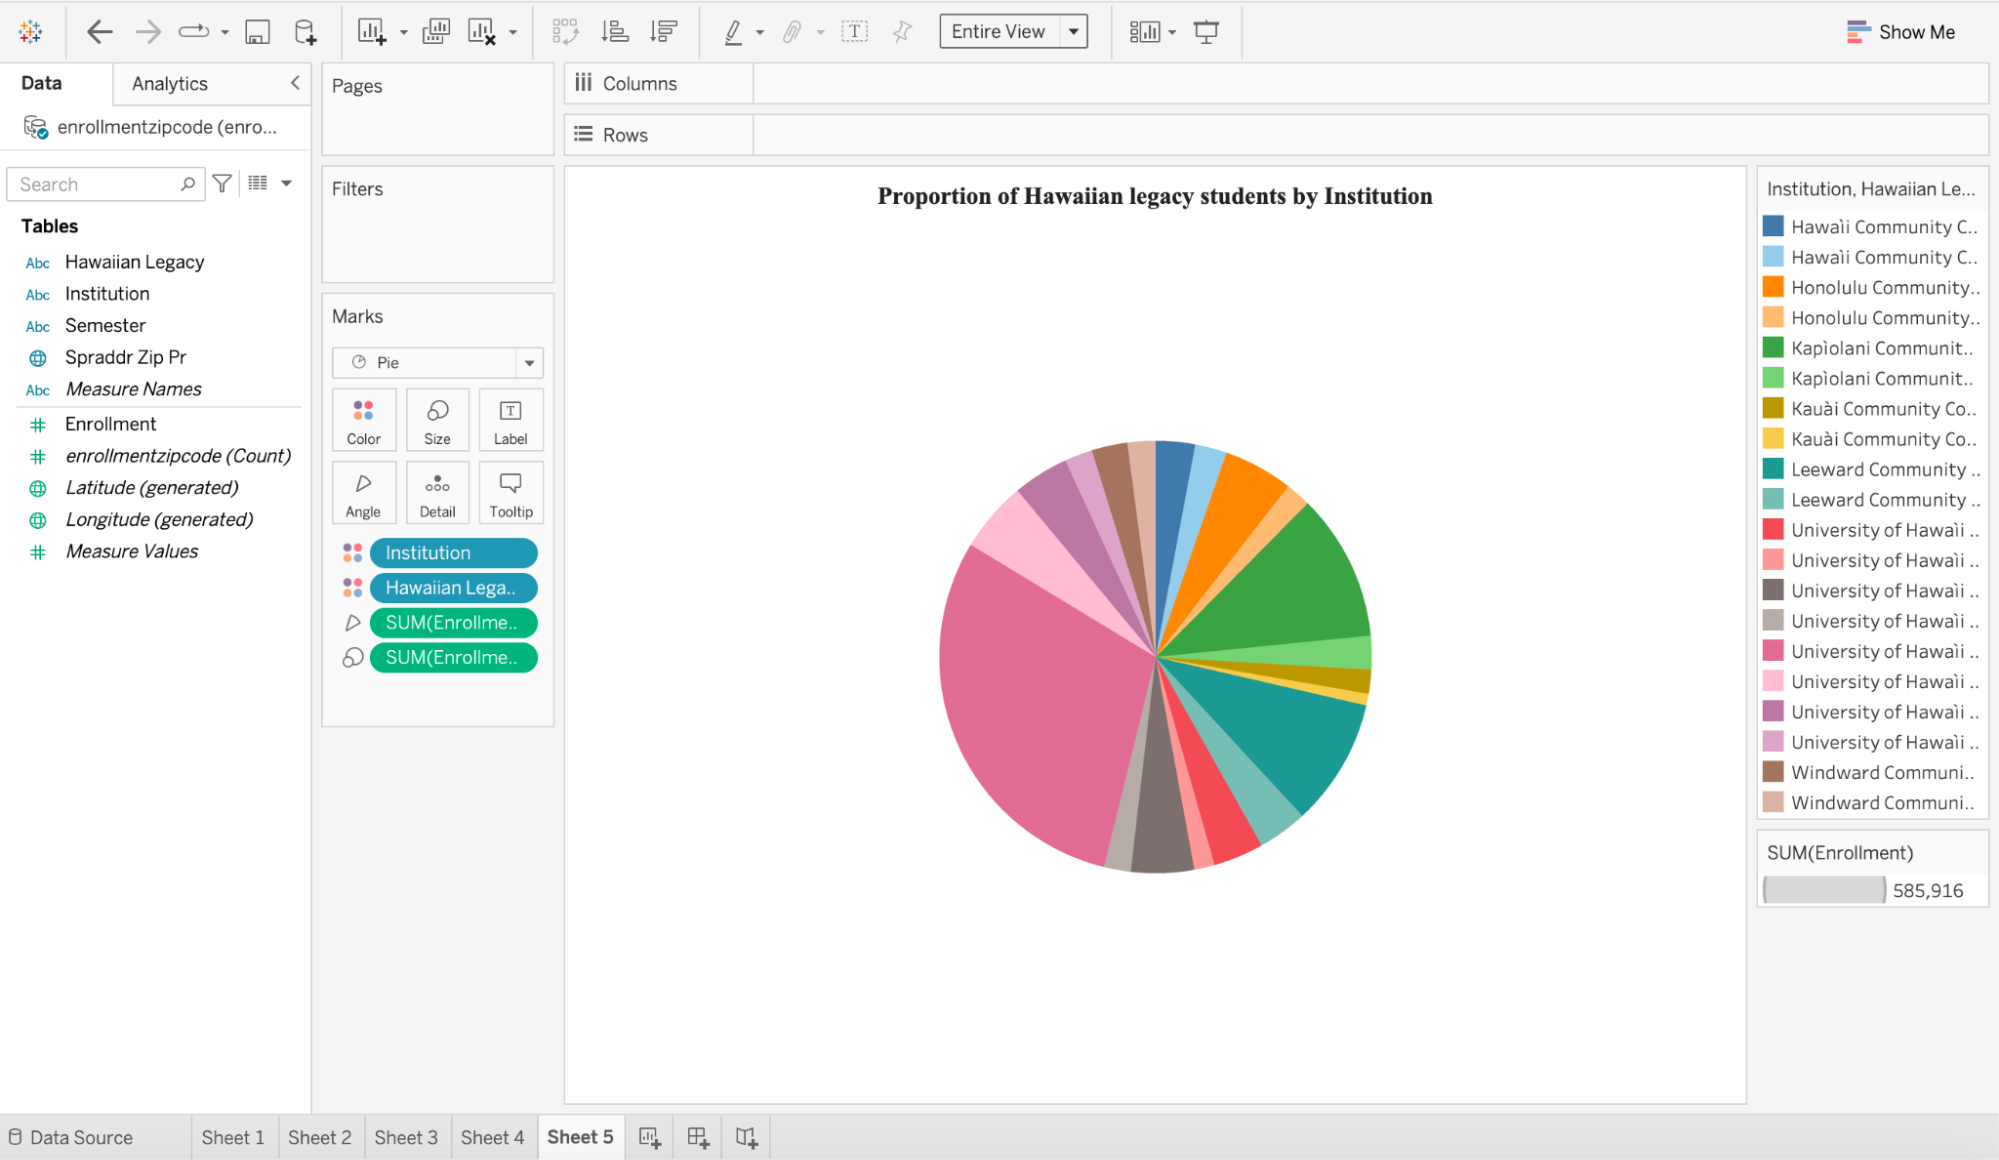
Visualization 3: pie chart (proportion of Hawaiian legacy students by institution)
- Open sheet 3 to add new figure
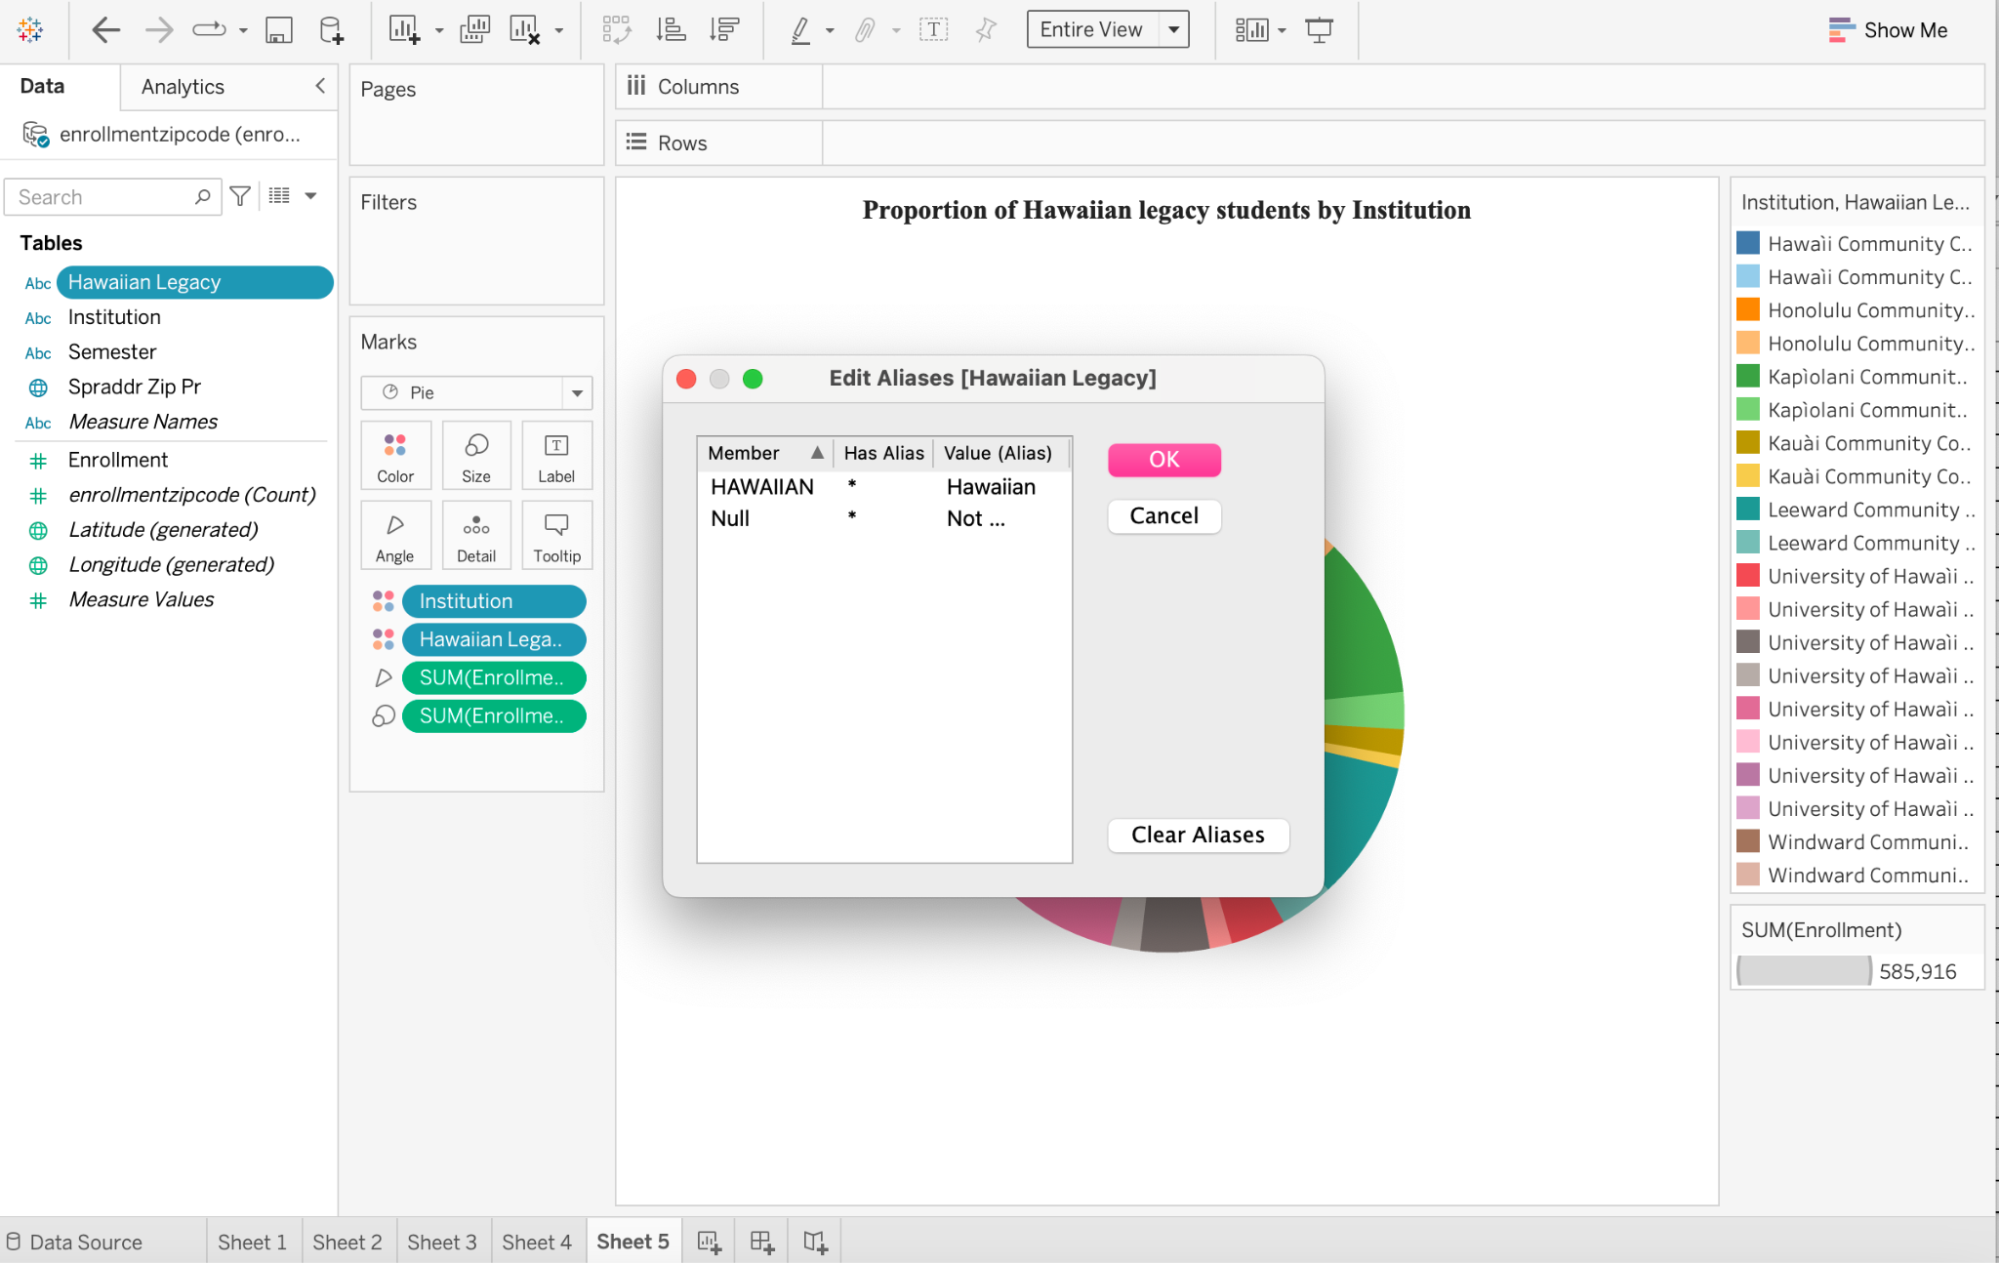
- Drag “Institution,” “Hawaiian legacy,” and “Enrollment,” field to the marks section.
- In the “Show Me” window on the right side of the Book click the pie graph icon to display figure
- To edit the name of the Hawaiian legacy on the tool tip, right click “Hawaiian legacy” and click “Aliases” and change the name under “Value” to rename null for non hawaiian legacy students.
- The same steps to editing the bar graph can be applied to the line graph as well
Key Points
- Tableau has an easy-to-learn inteface.
- It’s easy to get started with Tableau.
- Simple graphs are very easy but complex graphs can be really hard to plot.