1. Why use data visualizations?
Learning Outcomes
This workshop will enable you to:
- understand the role of data visualization in the research enterprise;
- increase your awareness of what makes good and bad visualizations;
- know basic steps for creating effective visualizations;
- know about contemporary tools for creating visualizations.
Overview
Data Visualization is a vast field so it would be impossible to cover everything in a 2-hour workshop. Like literacy, good data visualization takes years to master.
So this workshop is intended to introduce you to data visualization by:
- Giving you an example of a good visualization;
- Increasing you awareness of common visualization mistakes;
- Providing you with tips on how to approach creating more effective visualizations;
- Providing you with a source for good visualizations for you to aspire to;
- Introducing you to contemporary tools.
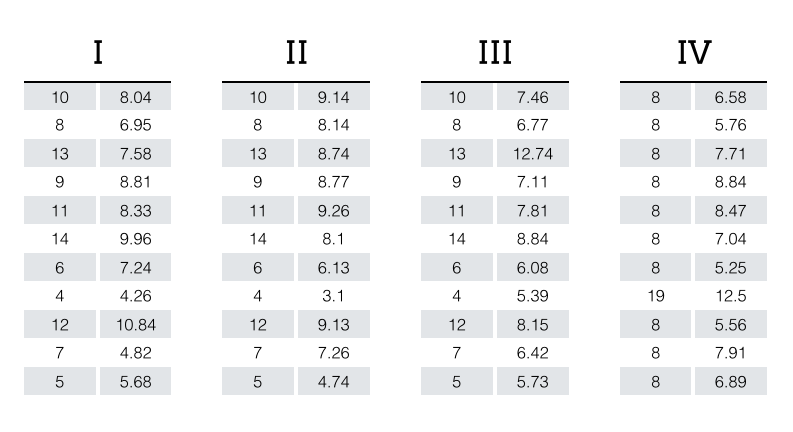
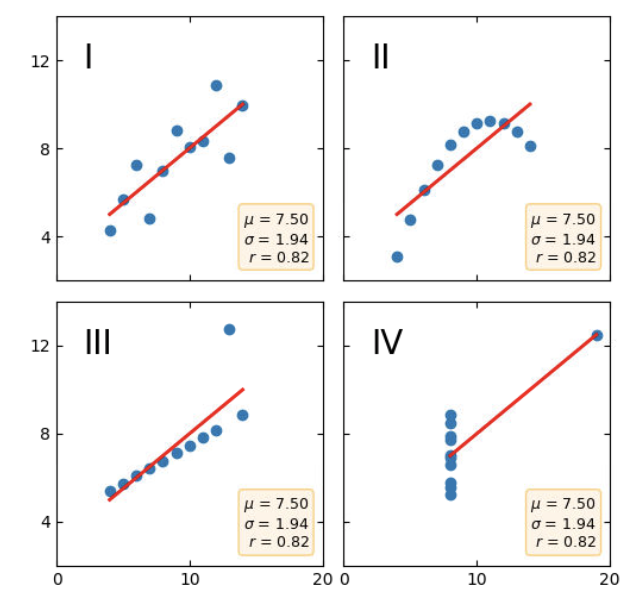
A quick motivation to learn data visualization: throughout this program and your academic journey you learn how to look at data and analyze it. Often, your first look at data involves simple statistics. But those numbers don’t show the full story, consider Anscombe’s Quartet, 4 data sets with the same statistical properties… but very different trends. The graphs immediately show us these trends.
So, why visualization?
-
Many uses throughout the research process:
- Identify problems/unexpected features in the data (see outliers or other trends like in Anscombe’s Quartet)
- Data exploration (seeing large scale trends vs. local trends in the data)
- Analysis (forming theories and proving them with visual analytics)
- Presentation (tell stories about your data, communicating with wide audiences)
- Many graphic ways to illustrate scientific data
- Images/Diagrams
- Animations
- 2D/3D
- Present large amounts of data in a compressed way (a graph is worth a thousand table rows)
- Supports side-by-side (or overlaid) visual comparison between pieces of data
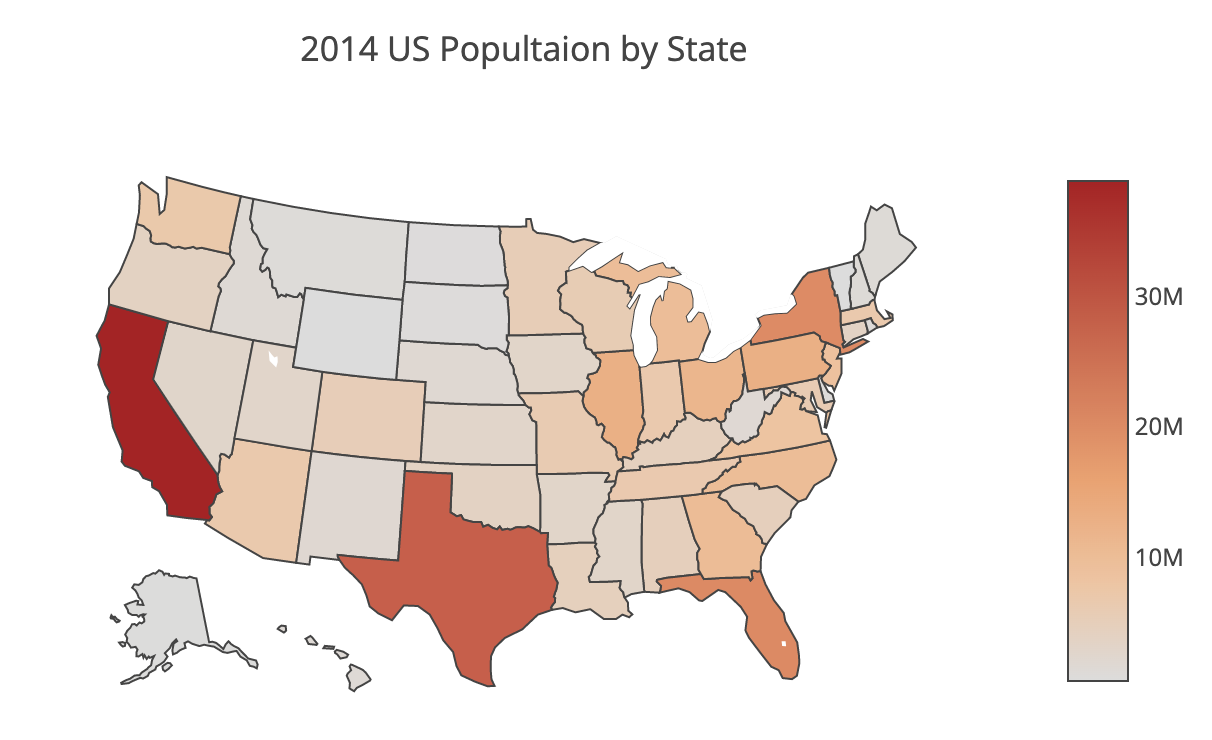
- Geospatial related data is reliant on graphical representation
Visualization existed in various forms throughout history, however, some of the first statistical charts (like line and bar charts) were first seen in 1786, when William Playfair, a politician, created them to illustrate the policies he was promoting. Other notable occurrences of historical visualization innovation are Dr. John Snow’s cholera map and Florence Nightingale’s coxcomb diagram illustrating the importance of sanitation. Here we will look at Charles Joseph Minard’s 1861 graphic showing Napoleon’s losses during his 1812 march to and from Moscow.
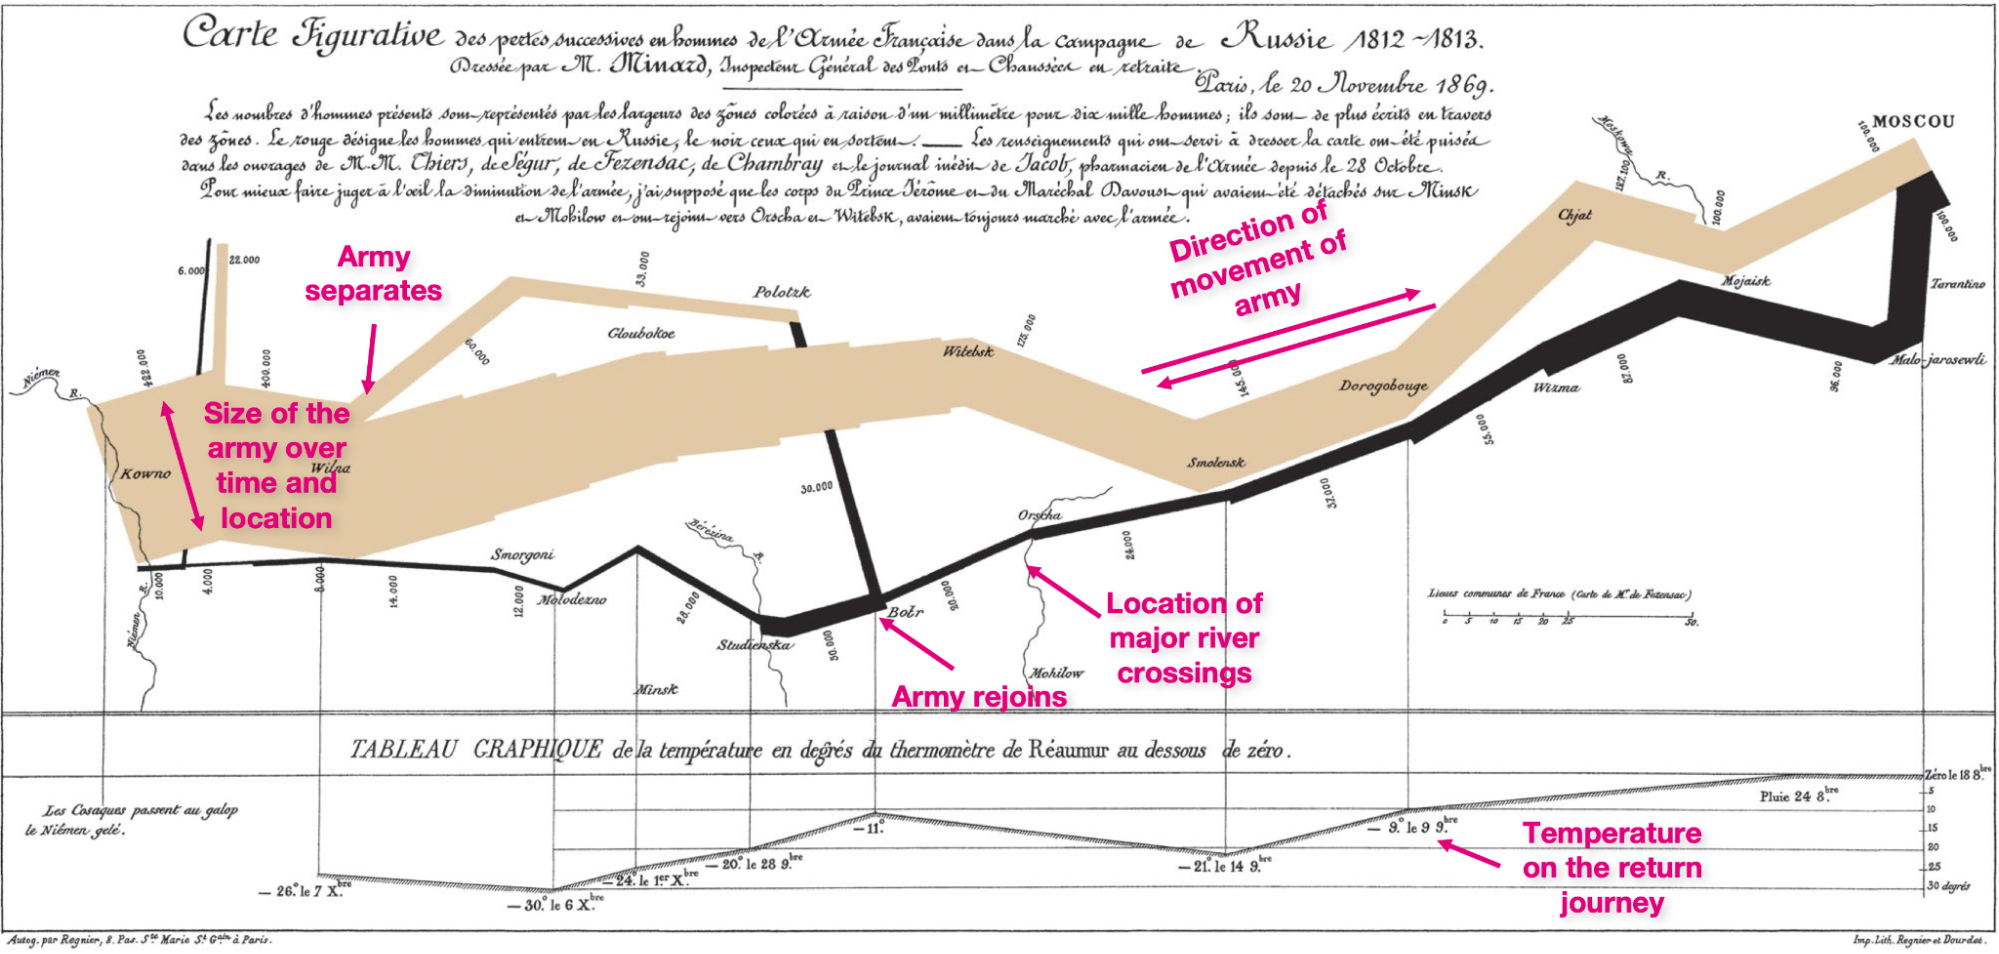
The figure successfully shows 5 pieces of information in one image:
- Size of the army (thickness of the line) and where they split/join
- Location on a 2D map
- Direction of the army’s movement (brown headed toward Moscow, black is headed back)
- Temperature (located below the map, highlighting key points)
- Location of major river crossings (rivers are marked on the map)
Minard’s chart conveys all that information while maintaining a simple and uncluttered aesthetic and is a great example of good design in visualization.
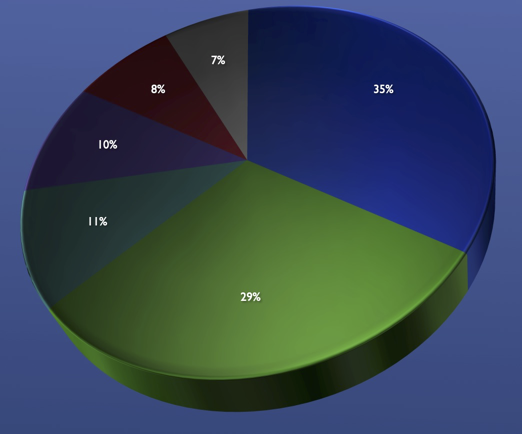
Much like there is good design, we need to beware of bad design. Bad visualization can lead to errors both to you and to the people with whom you wish to share your science.
For example, the 3D pie chart below is tilted which skews the way we perceive the sections, making the green (29%) look bigger than the blue (35%) segment.
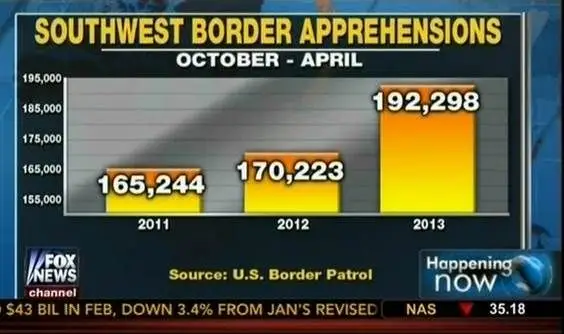
Often, people show bar charts using a y-axis that doesn’t start at 0. This is often done to focus on “the more interesting part”, but it effectively skews the perceived magnitude of the data shown.
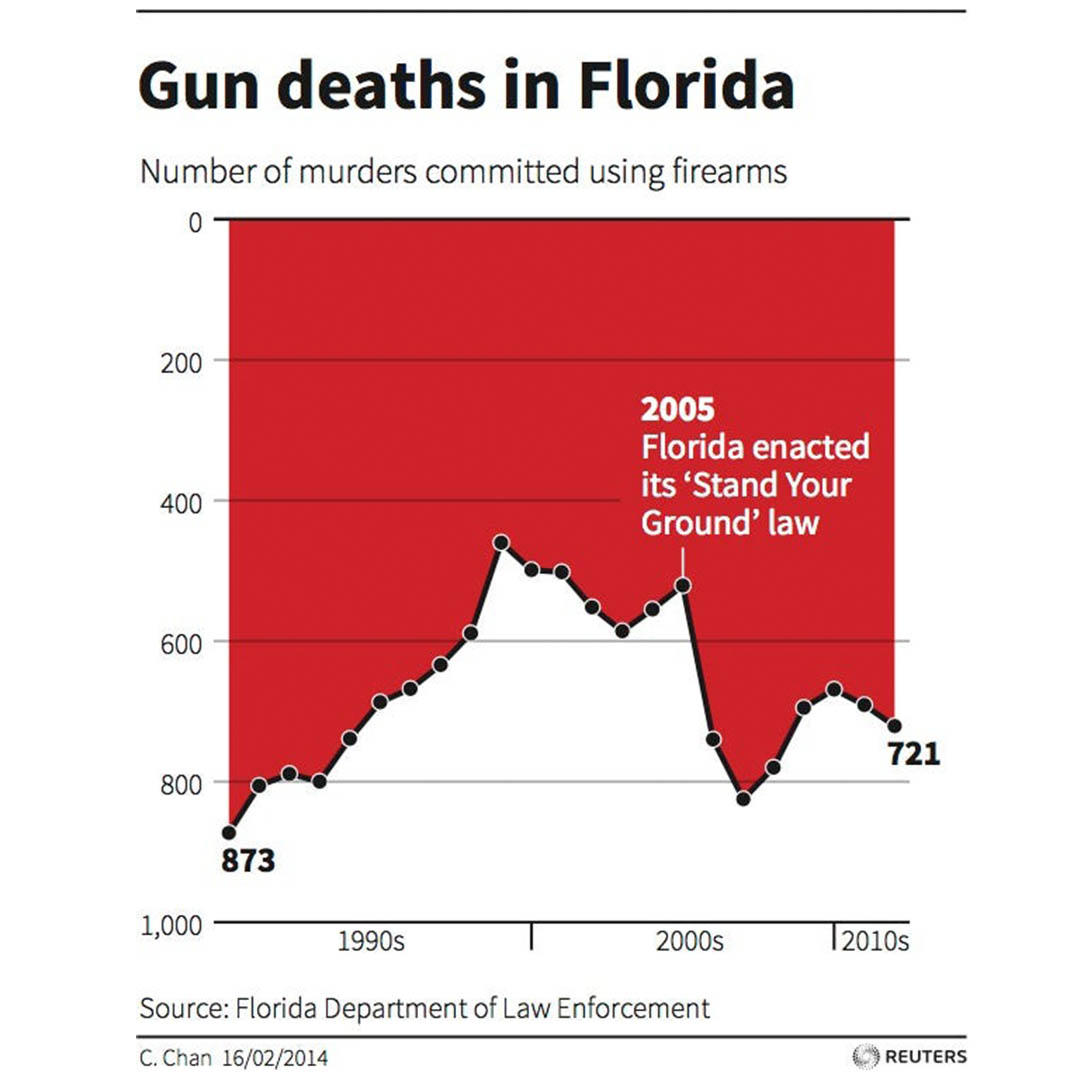
Some chart deception is even more blatant. Can you see what is wrong with the chart below?
We will talk more about making good visualizations in the next section.
Key Points
Data visualization isn’t something that is only done at the end of a research project, it should be used throughout. It can help find problems with the data early during the gathering process, it can help you accelerate comprehension of the data, it can help you see both scale and complexity in the data, it can help you discover unanticipated emergent features in the data, it can help you form new hypotheses, and it can help you tell more compeling stories about data.
- Data visualization is a complex field unto is itself, and producing good visualizations requires constant awareness of good as well as bad examples.
- Producing good visualizations requires effective mapping of data attributes to pre-attentively processed visual cues.