4. Mechanics of Creativity
Overview
Key Points
- We want to free our brains for creative thinking by relieving them of Executive Attention Network tasks.
- Emphasize quantity over quality when generating creative ideas.
- Many creative idea generation methods exist.
Objectives
- Identify some preferred ways to relieve our Executive Attention Network from tasks when creating.
- Discuss some of Dr. Leigh’s favorite creative thinking methods.
- See some examples of creative thinking methods.
Method to the Madness
Now that we have entered our space/time oasis and activated open mode…what now? Well, we start being creative! Let us look at some creativity exercises to get us going.
First, we want to free up our brain’s “computing power” so we can use as much of it as possible for creating. We can free up our brain’s “RAM” by selecting a preferred method for recording creative ideas as they come (pen & paper, typing, drawing, sticky notes, note cards, etc.). This is critical since our working memory (belonging to the Executive Attention Network) can only hold up to 7 things at one time.
Now, we can examine some methods for creative thinking.
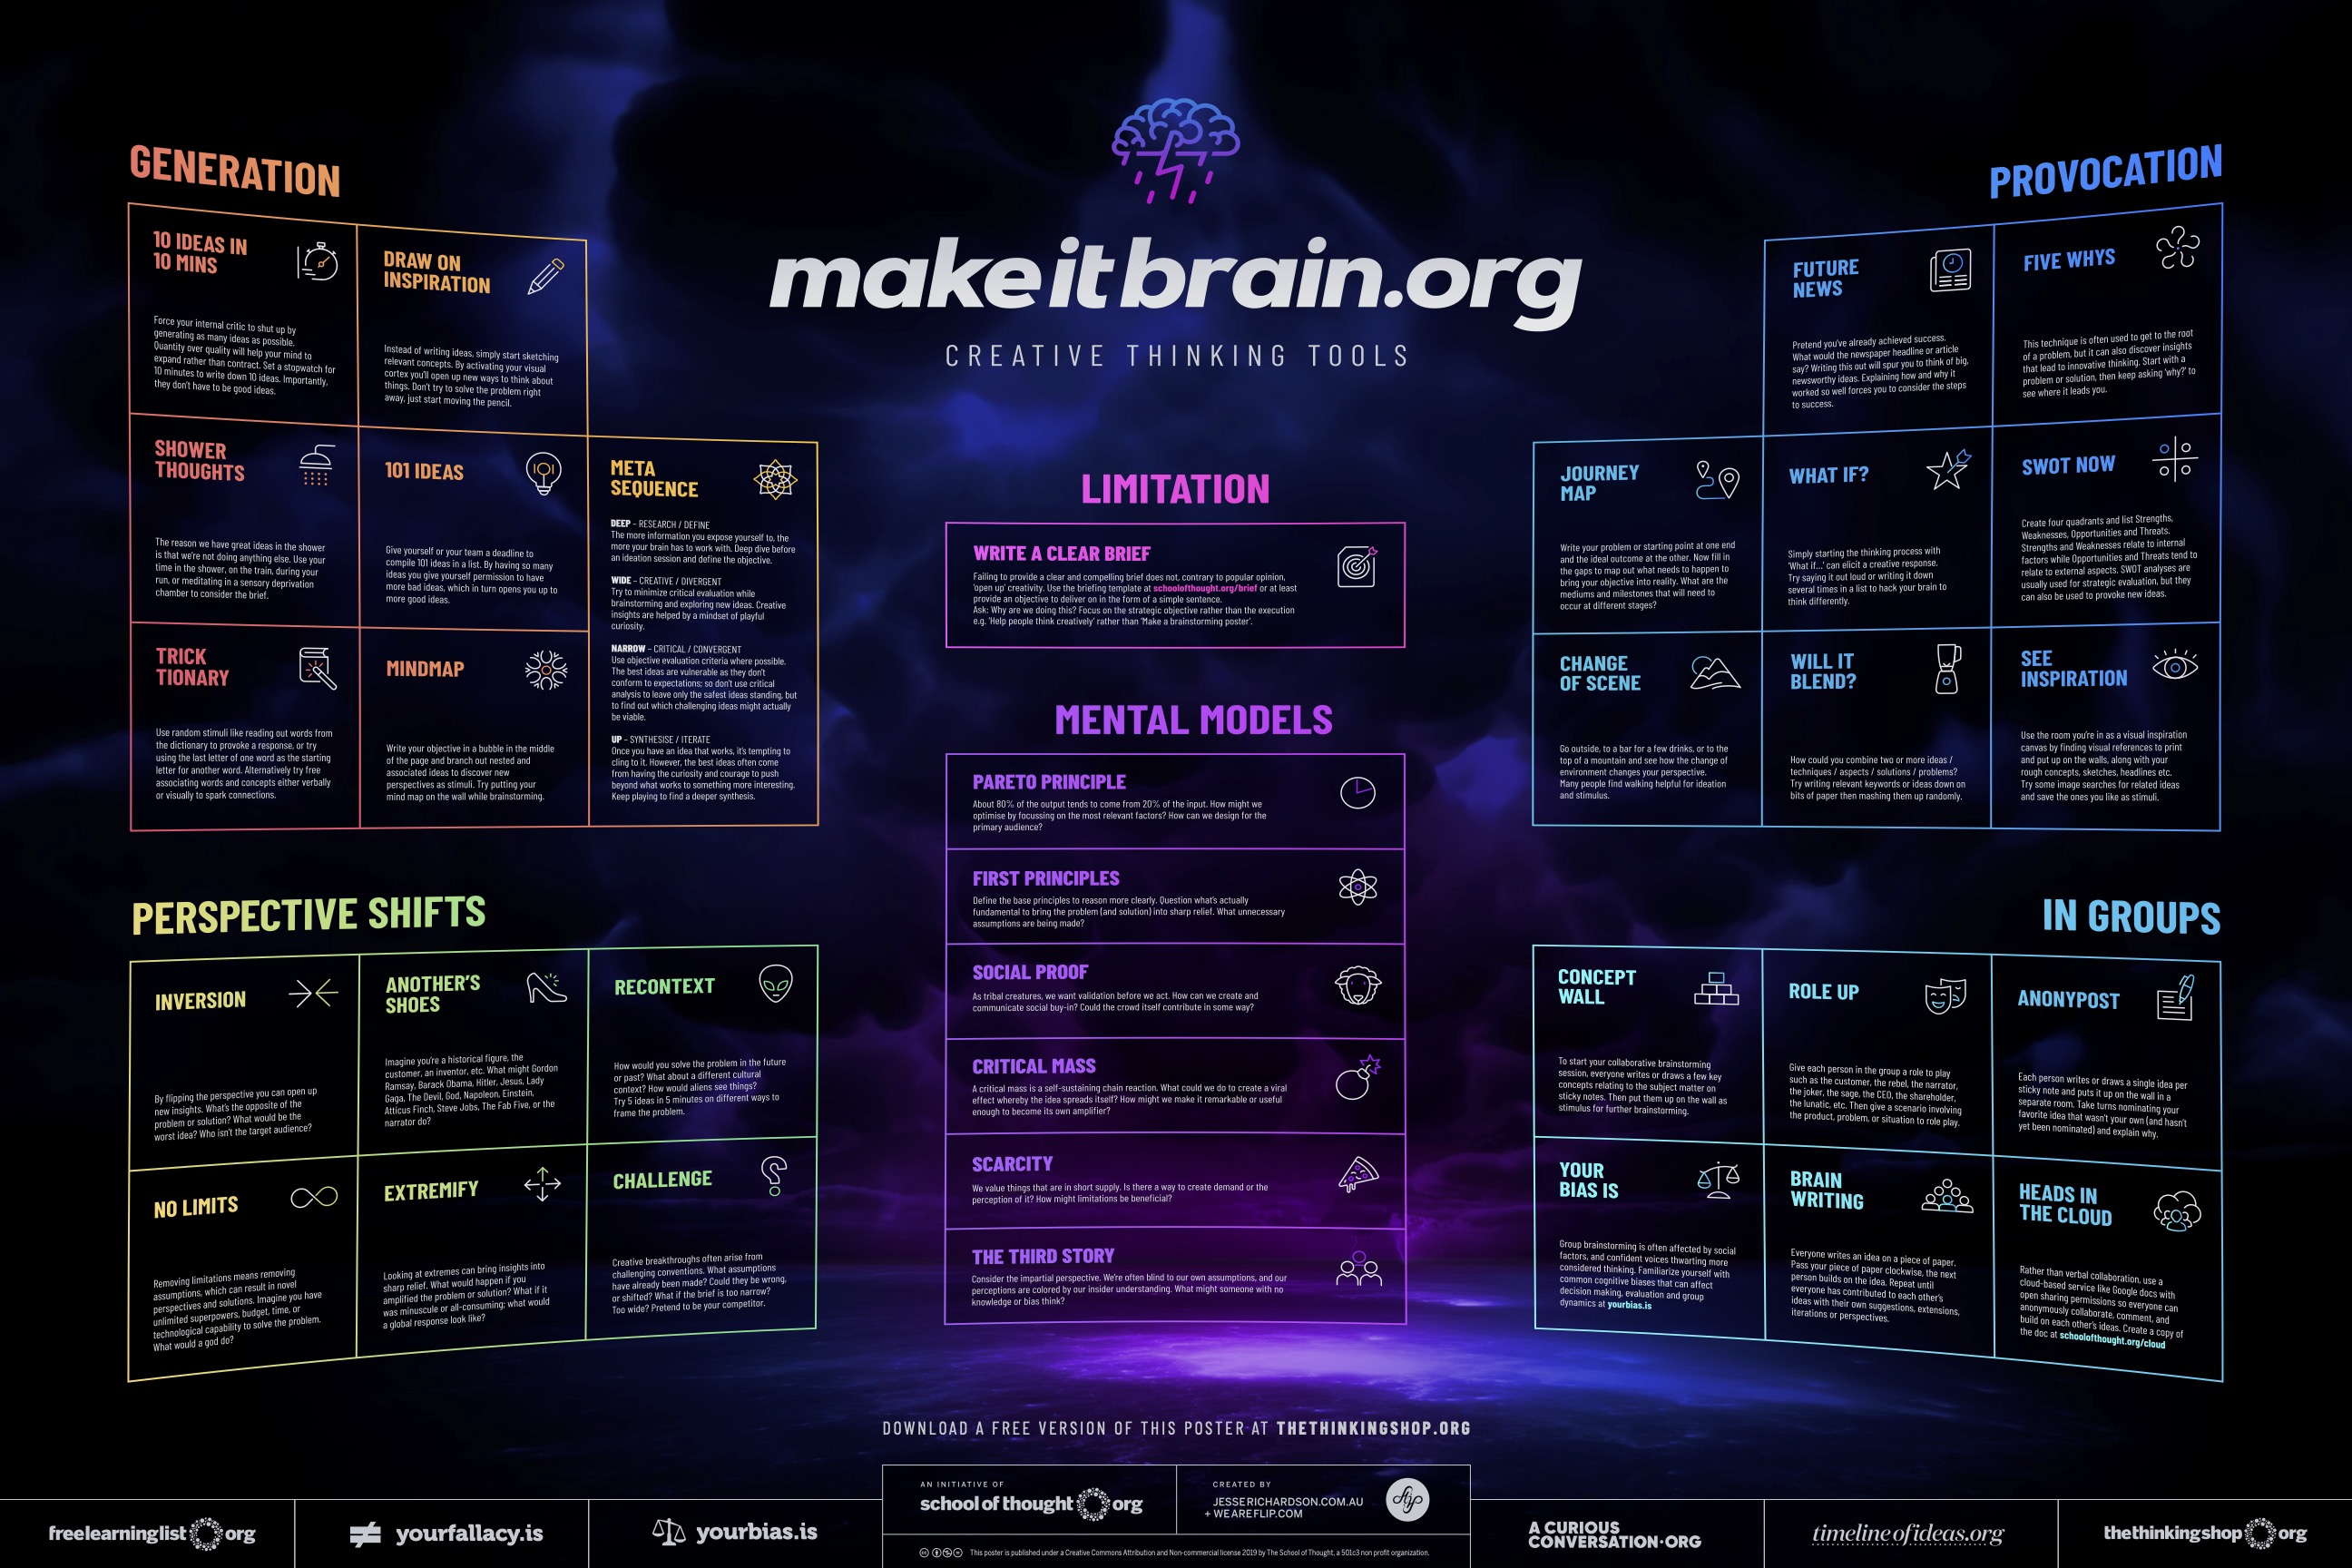
Dr. Leigh’s Favorite Creative Thinking Methods
- 10 Ideas in 10 Minutes: Set a clock for 10 minutes and write down as many ideas as possible. Write fast and furiously without stopping to judge your ideas.
- Concept Wall: Have everyone write or draw on sticky notes and put them up on the wall as stimulus for further brainstorming.
- 101 Ideas: Give yourself or your team a deadline to compile 101 ideas. By having so many ideas, you give yourself permission to have bad ideas, which in turn opens you up to good ideas.
- Will It Blend?: This approach looks at how individual ideas that may seem incongruent can be blended together to create new viable ideas. To start, write relevant keywords or ideas down and then mash them up randomly.
- See Inspration: For artists this usually means looking at lots of pictures from books, magazines, online, etc. For scientists and engineers this often means reading lots of research papers.
- Anonypost Sometimes individuals are not confident in posting ideas publicly, even though they may have really good ideas. Providing a channel for anonymous sharing of ideas allows completely judgement free sharing.
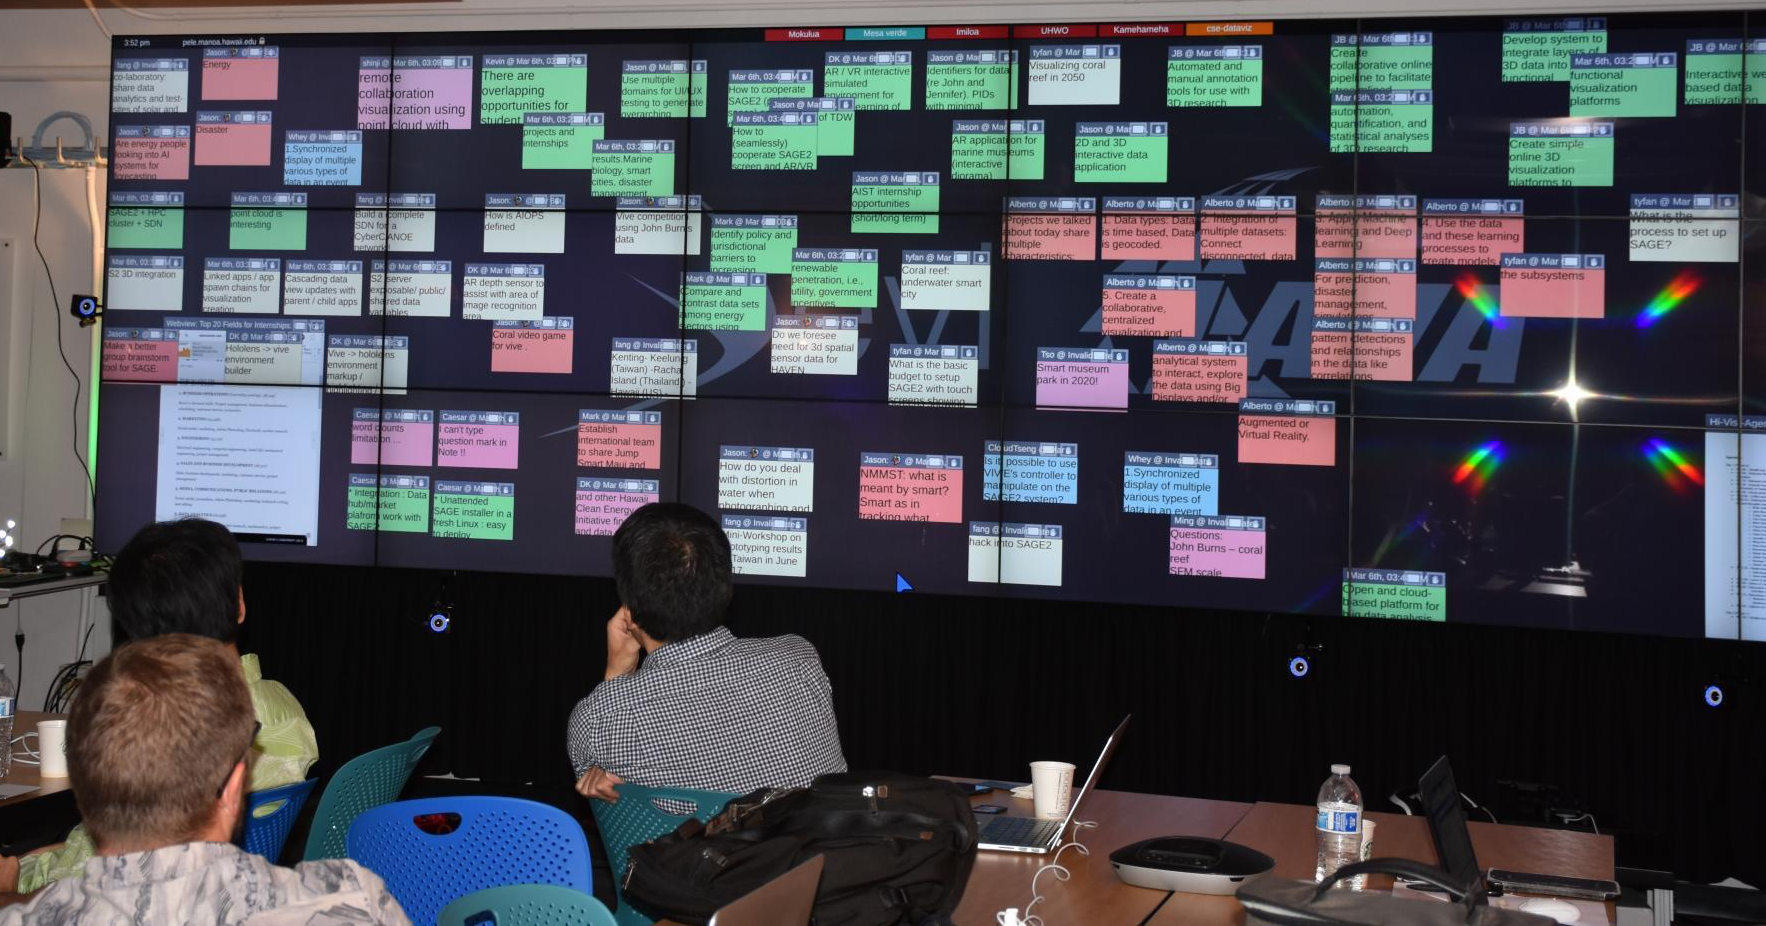
Concept Wall
Here is an example from a meeting between collaborators from US, Japan and Taiwan. The task was to come up with possible joint research projects. Everyone in the group was given 30 minutes to quietly brainstorm on their own and then share their ideas to a communal SAGE board for group discussion.
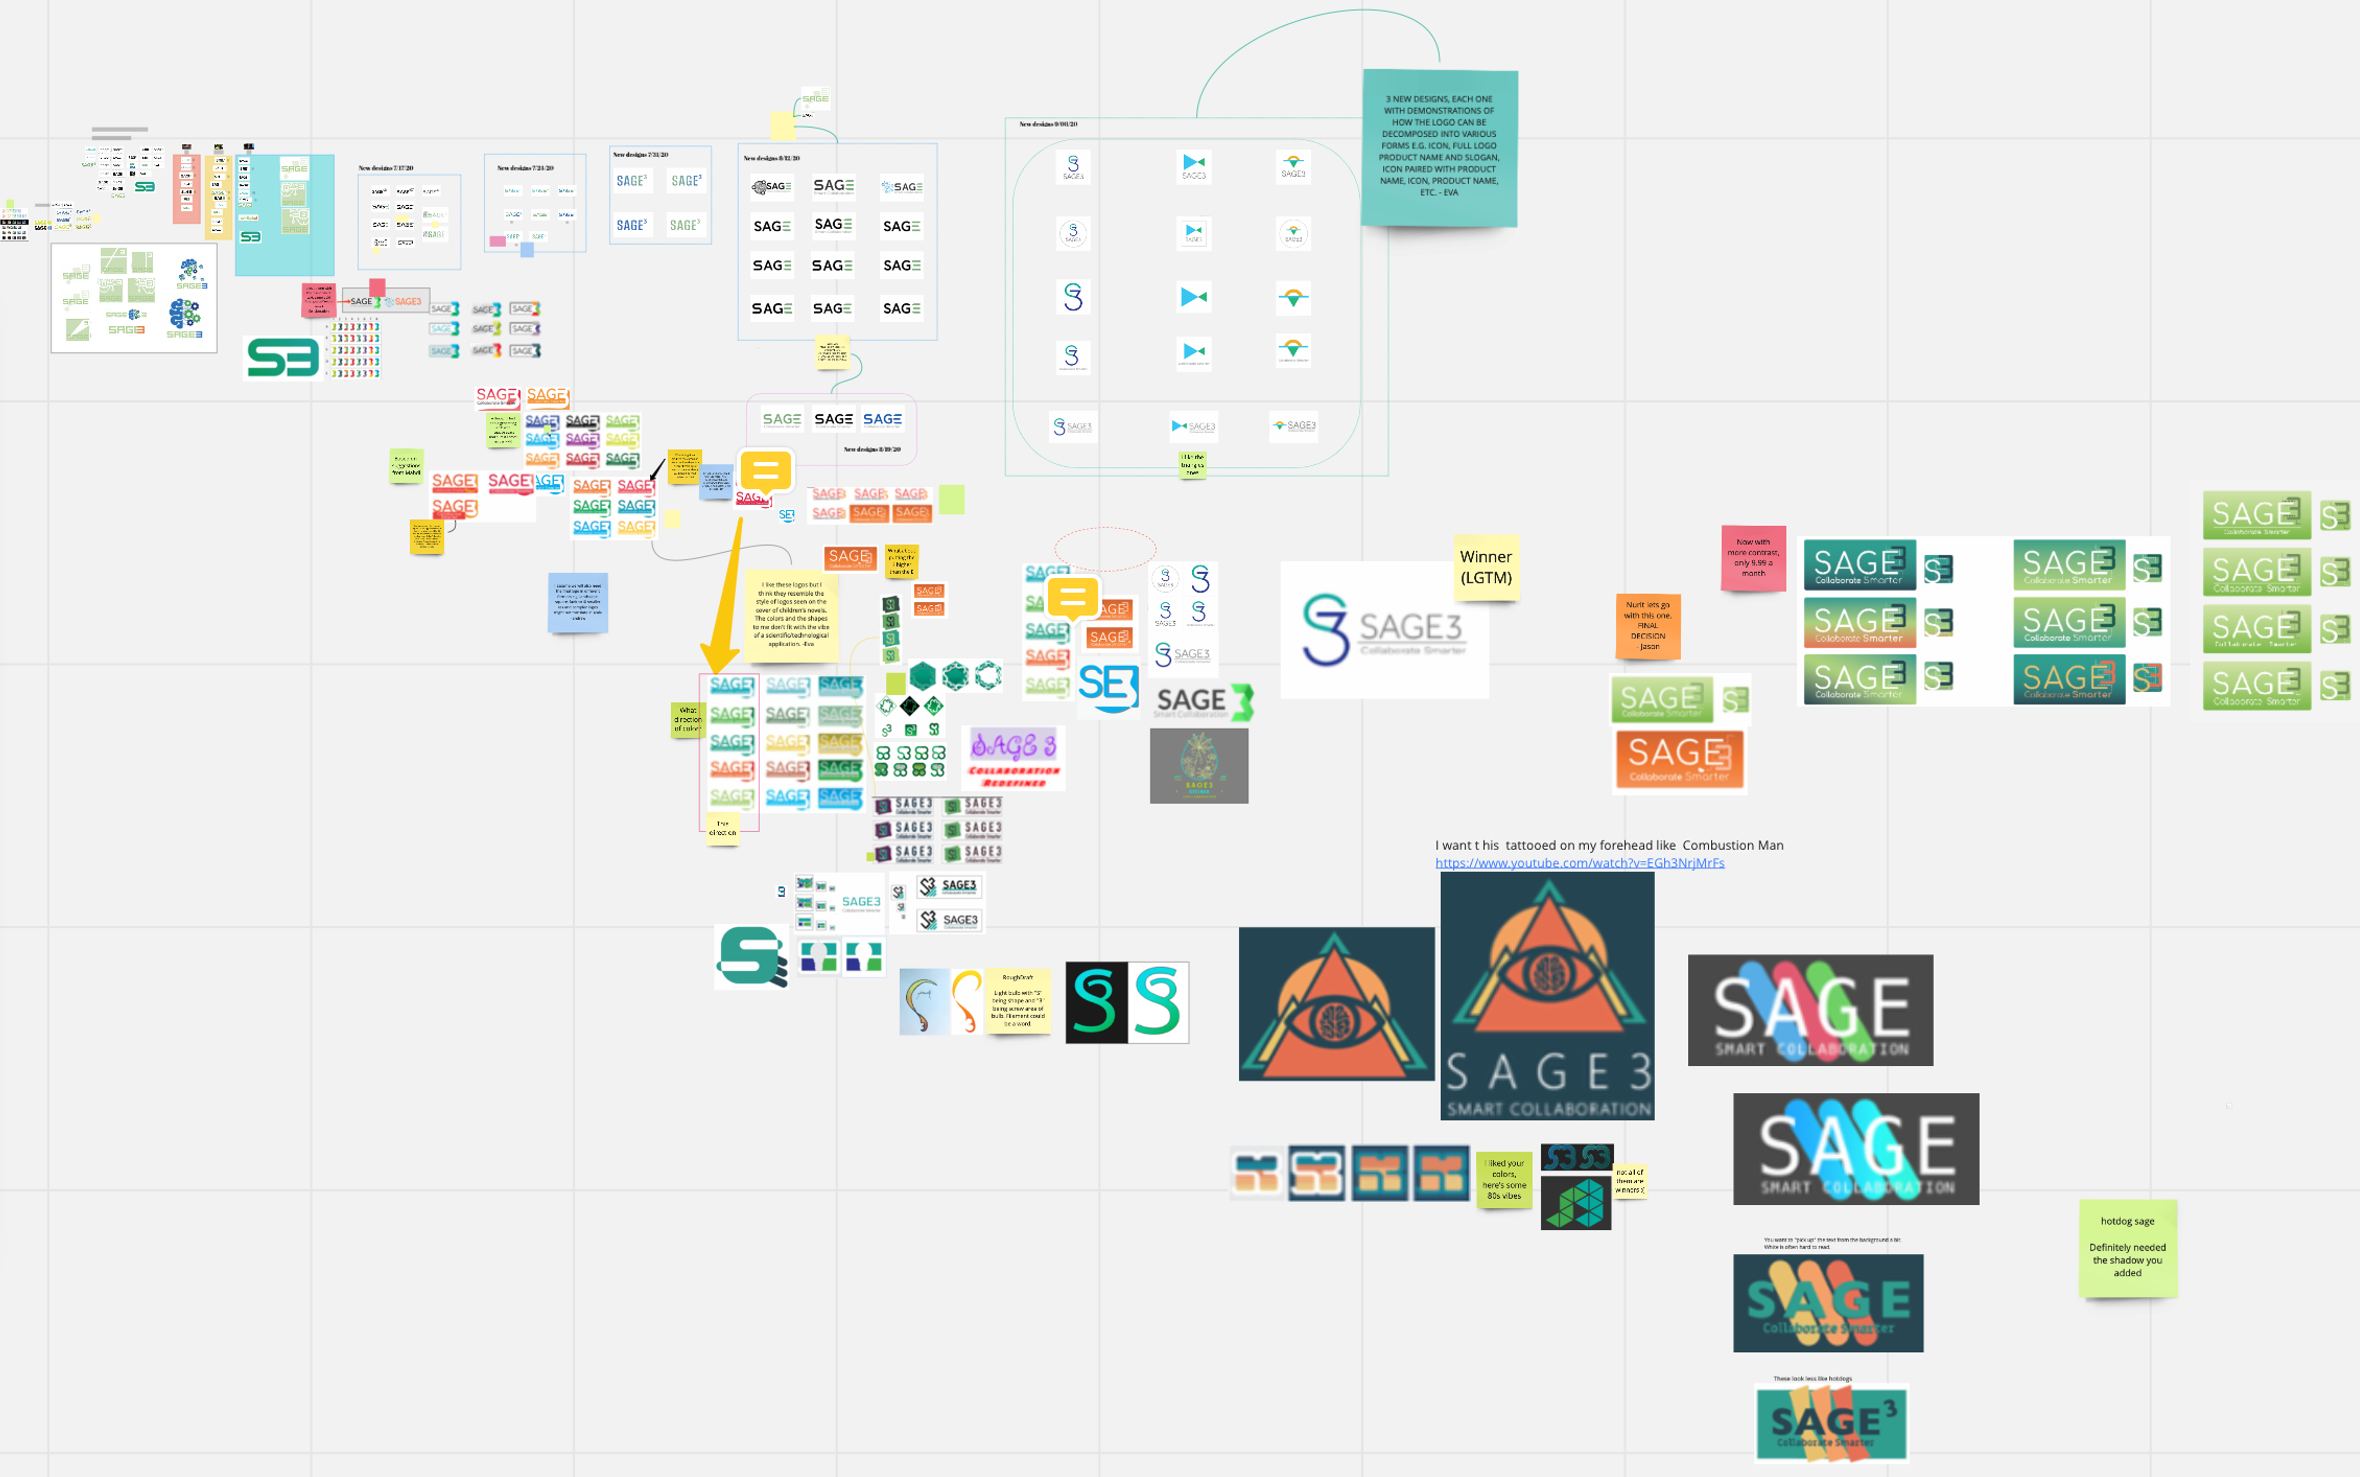
101 Ideas
Here is an example for the design of the SAGE3 logo over the course of 3 months. The final logo wasn’t the last logo designed. It was the design created roughly at the 2 month mark. Throughout the 3 month period, contributors could continue to review the board of designs and add new ones.
Will It Blend?
I don’t know. Let’s find out.
Here’s another example of blending ideas.
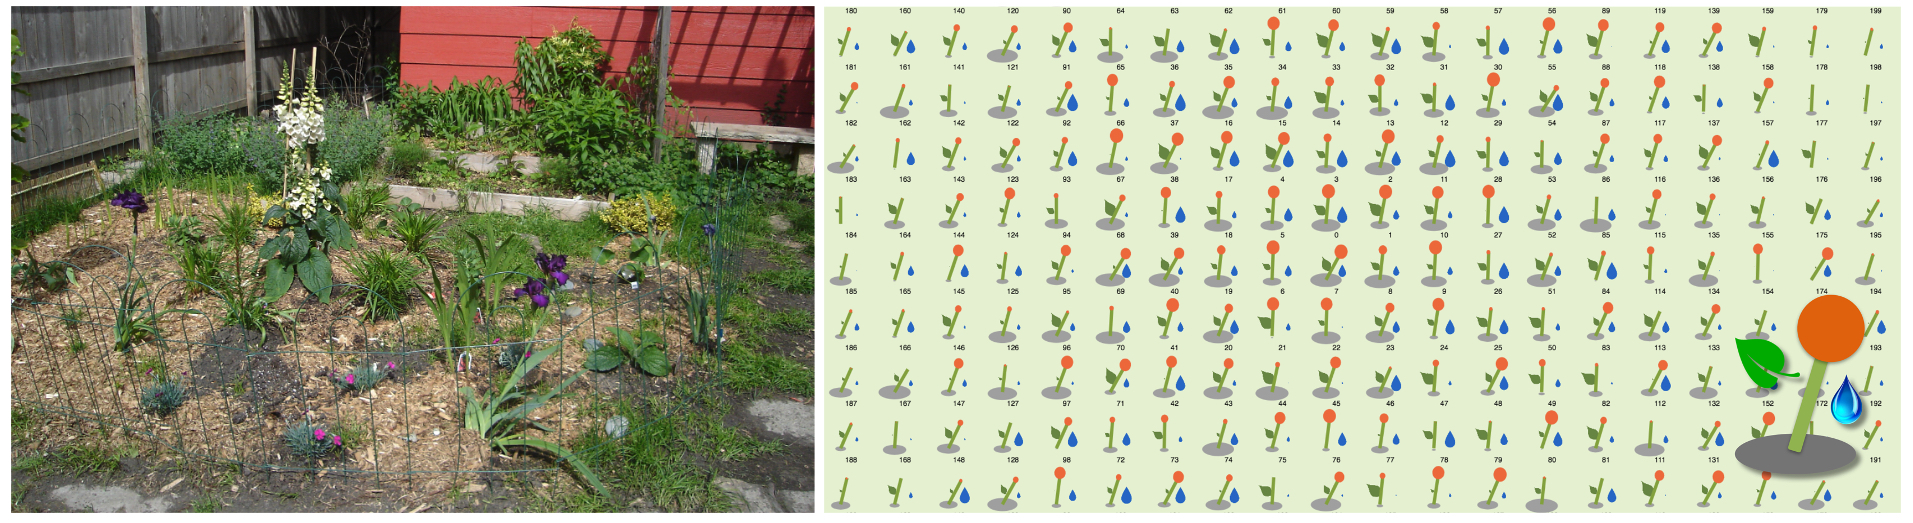
The picture on the right is an experimental visualization of scenarios for bringing Hawaiʻi to 100% renewable energy by 2045. Each scenario is visualized as an individual flower where: the size of the petal represents the proportion of solar farms; the tilt of the stem represents the proportion of wind farms; the size of the leaf represents the quantity of biofuels; the size of the water droplet represents hydro-electric power; and the size of the ground represents fossil fuels. This idea came from Dr. Leigh’s garden in Chicago (shown on the left). He noticed how certain things in the garden were easy to spot (like the flowers or the weeds), so he wondered whether this could be applied to visualizing data to make salient data attributes easier to see.
See Inspiration
Here is a picture from BMW’s wall of inspiration. The top contains a list of decades. Below that sits pictures of architectural designs through the ages. The middle rows consist of pictures of cars, and lastly, the bottom row contains pictures of fashion. Since people see cars in the context of their surroundings, BWM sought to think about the car’s design in that same context. Their designers draw inspiration from the evolution of trends in all of these areas. Notice that the black tape captures salient connections between pictures.
Anonypost
SAGE3 has features that support anonymous sharing of ideas. SAGE3 lets users temporarily change their name. Also by default, when sticky notes are posted in SAGE3, the title bar is hidden, which also hides who posted the idea.
Bonus: Persisting Artifacts
An artifact is anything contributed to a brainstorm (notes, pictures, etc.). Sometimes, it is useful to be able to see the entire brainstorm and all its artifacts over the course of months and possibly years, as in the BMW example. Continuing with the automaker example, this video below explains why even in the age of computers, clay models are still used to design cars.
When Dr. Leigh collaborated with General Motors in the early 1990s, the head of the computer division at the time, Randy Smith, was using virtual reality to model their cars. He said that one of the advantages of a full scale clay model is that the model is the first thing you see when you come in the office every day. Seeing the model mimics how consumers will see their car every day. The car is always in the designer’s consciousness.
Another example comes from the University of Michigan’s Atmospheric Sciences department. The lab used to post printed outputs of their simulations each week on a pin-up board in the laboratory’s lunch room. That way the board was always in view during lunch time, or whenever someone walked by the room. In 2005, they adopted SAGE to create a fully digital version of the same pin-up board which included the added ability to view animations of their simulations as well.
Here is an example of a 2016 brainstorm board for the LAVA lab. It started out with students posting research ideas on the wall. The lab left this board up for a month, and each day more notes would appear. Eventually when the lab felt that they had enough ideas, they started grouping the ideas into the categories: things they were funded to do, things they were capable of doing, things they wanted to do, random ideas that they may or may not have wanted to do, and things that were big trendy ideas.
10 Ideas in 10 Minutes
Let us try this out right now.