3. Paraview Tutorial
Overview
Objectives
- Provide you with an understanding of the suitability of ParaView for your requirements.
- Demonstrate a series of simple steps for utilizing ParaView to generate a visual representation.
Overview
ParaView is an open source tool for scientific visualization. Areas of data visualization that normally fall under scientific visualization include: medical visualization, visualization of simulations from fluid dynamics, atmospheric science, cosmology, finite element meshes.
ParaView was developed by Kitware in collaboration with Lost Alamos National Lab with funding from the Department of Energy. It was developed to make scientific visualization easier to create for non-computer scientists. ParaView is built on top of the Visualization Toolkit (often referred to as VTK)- the library Computer Scientists have historically used to hand-craft scientific visualizations for domain scientists. VTK is arguably the most widely used scientific visualization library in the world.
This workshop will:
- Explain why ParaView is an ideal tool for scientific visualization;
- Show you some fundamentals about the tool;
- Show you how to produce a simple visualization;
- Point you to a detailed tutorial document and book where you can learn more.
Why Paraview
Scientific simulations often run on high performance computing systems like Supercomputers or Compute Clusters and produce enormous amounts of simulation data (on the order of terabytes to petabytes). Common desktop statistical visualization tools like Excel, Tableau, Plotly etc are not well suited for scientific visualizations because they cannot scale to handle large data sets, and there are numerous data formats needed for scientific visualization that they do not support. ParaView solves these problems by being able to run in parallel across large scientific data sets on compute clusters to parallelize its production of visualizations. As ParaView has become such a staple for scientific visualization it supports a wide range of scientific data formats (as many as 220 distinct file formats). Here is a list of the data readers built into ParaView. For example, DICOM is a data file type often used in medical imaging, and NetCDF is used in climate science simulations.
Visualizing data in ParaView consists of three basic steps: reading the data with the appropriate data reader, applying filters to the data that generate, extract, or derive features from the data, and rendering to produce an image of the data. As ParaView is designed primarily to handle data with spatial representation, its primary data types are meshes.
ParaView’s User Interface
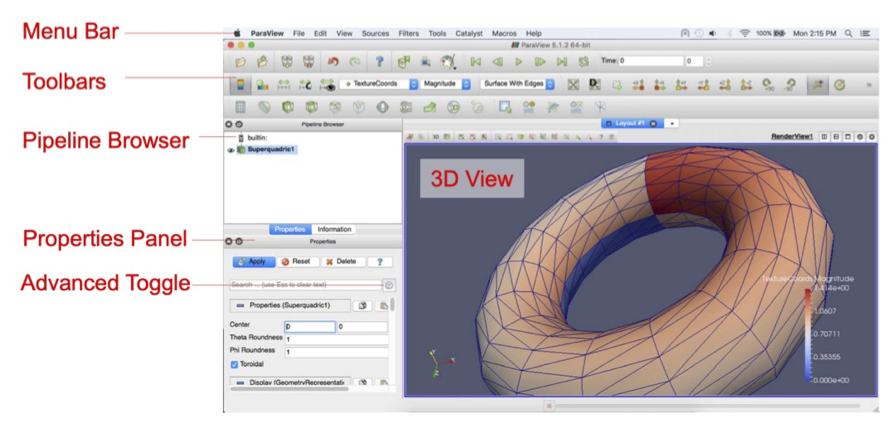
The ParaView interface is shown below with a description of the main elements.
The menu bar is where you access the majority of features. The toolbars provide quick access to commonly used features. The pipeline browser manages the reading and filtering of data with a pipeline. The pipeline browser lets you view the pipeline structure and select objects in the pipeline. The properties panel allows you to view and change the parameters of the current pipeline object. The advanced toggle shows/hides advaned controls. The 3D view is where your resulting visualization is shown.
Getting Started
Start by downloading ParaView.
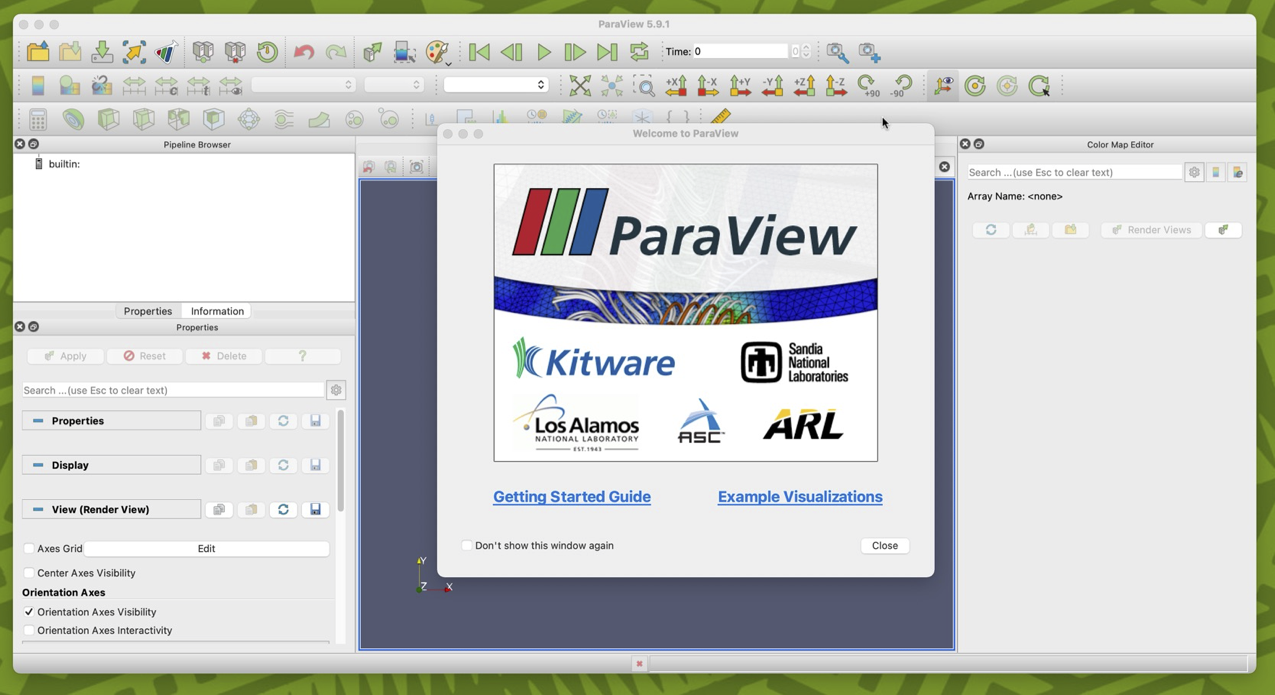
Once ParaView has been downloaded, launch it. The Welcome window should appear. From there click on Getting Started Guide.
The getting started guide is a 2-page PDF document like this:
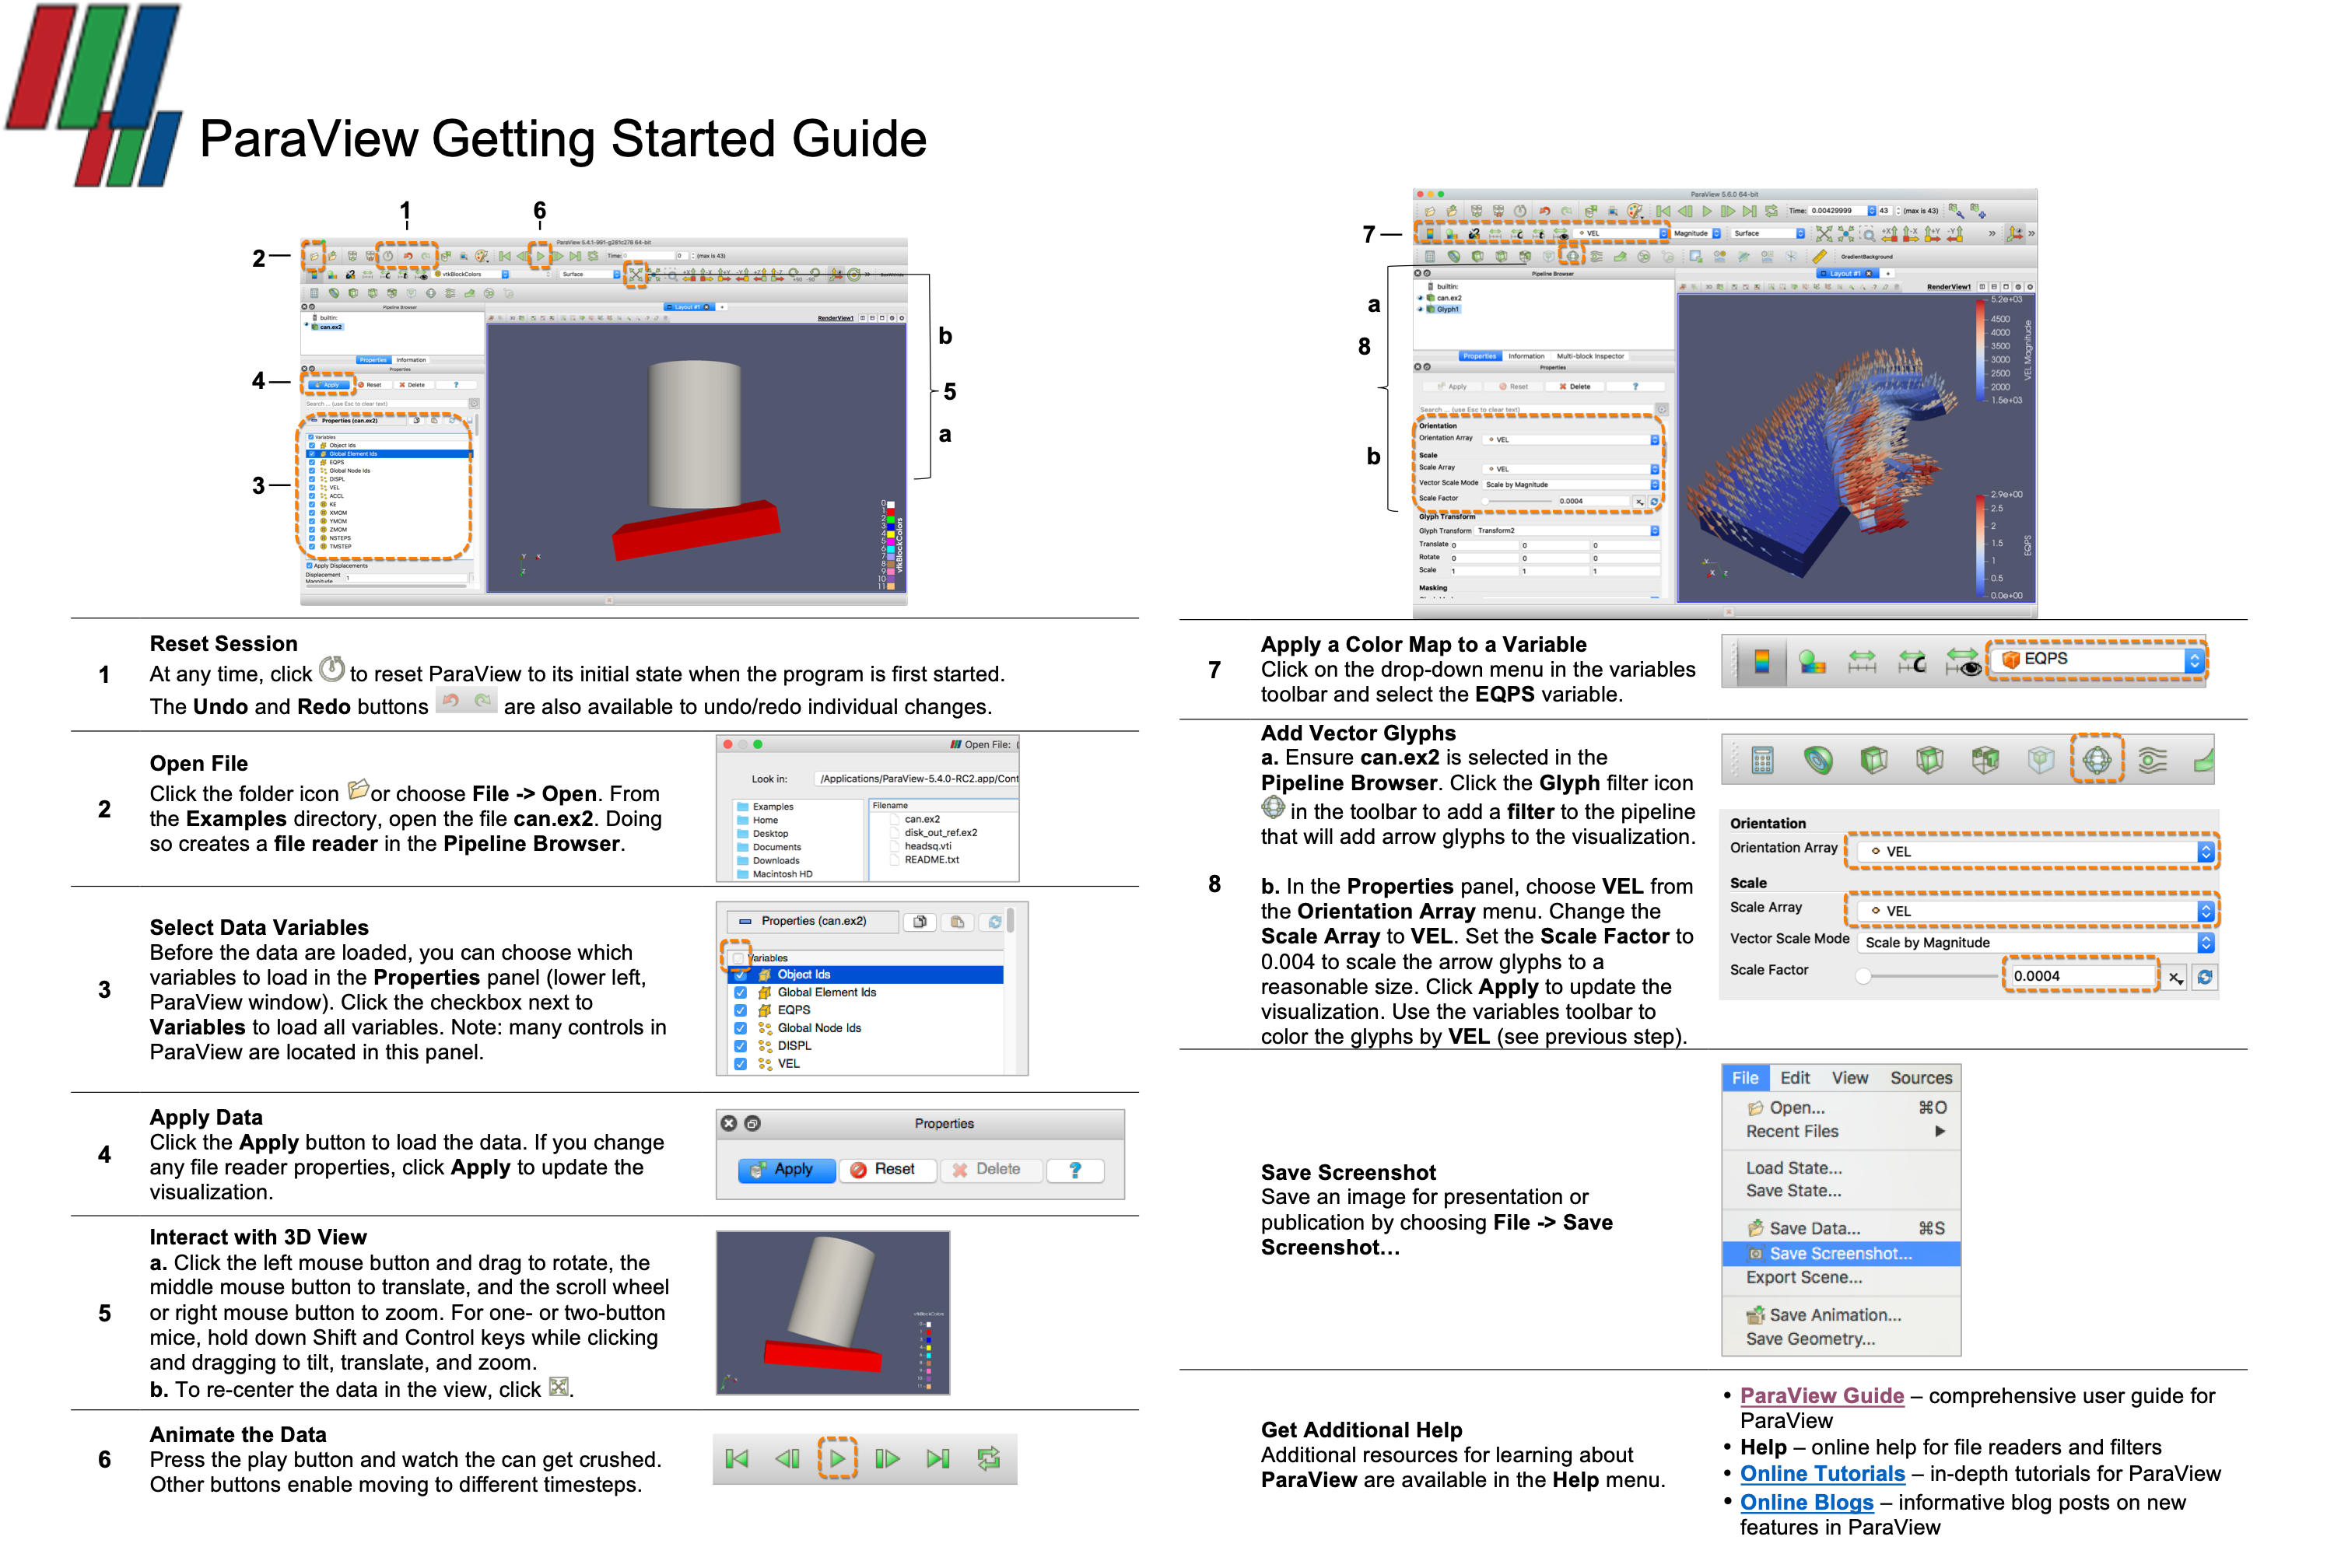
Follow the instructions in the guide to produce your first visualization. Congratulations, you’ve produced your first ParaView visualization.
If you’d like to try producing another visualization, this video shows how to visualize 3D volumetric data, such as medical data from an MRI scanner.
Key Points
- ParaView is a complex and powerful visualization tool
- It takes time to learn the software but useful online tutorials available to aid understanding
- Recall that when you started ParaView, it brought up a Welcome screen. On that screen were two options:
- Getting Started Guide and
- Example Visualizations.
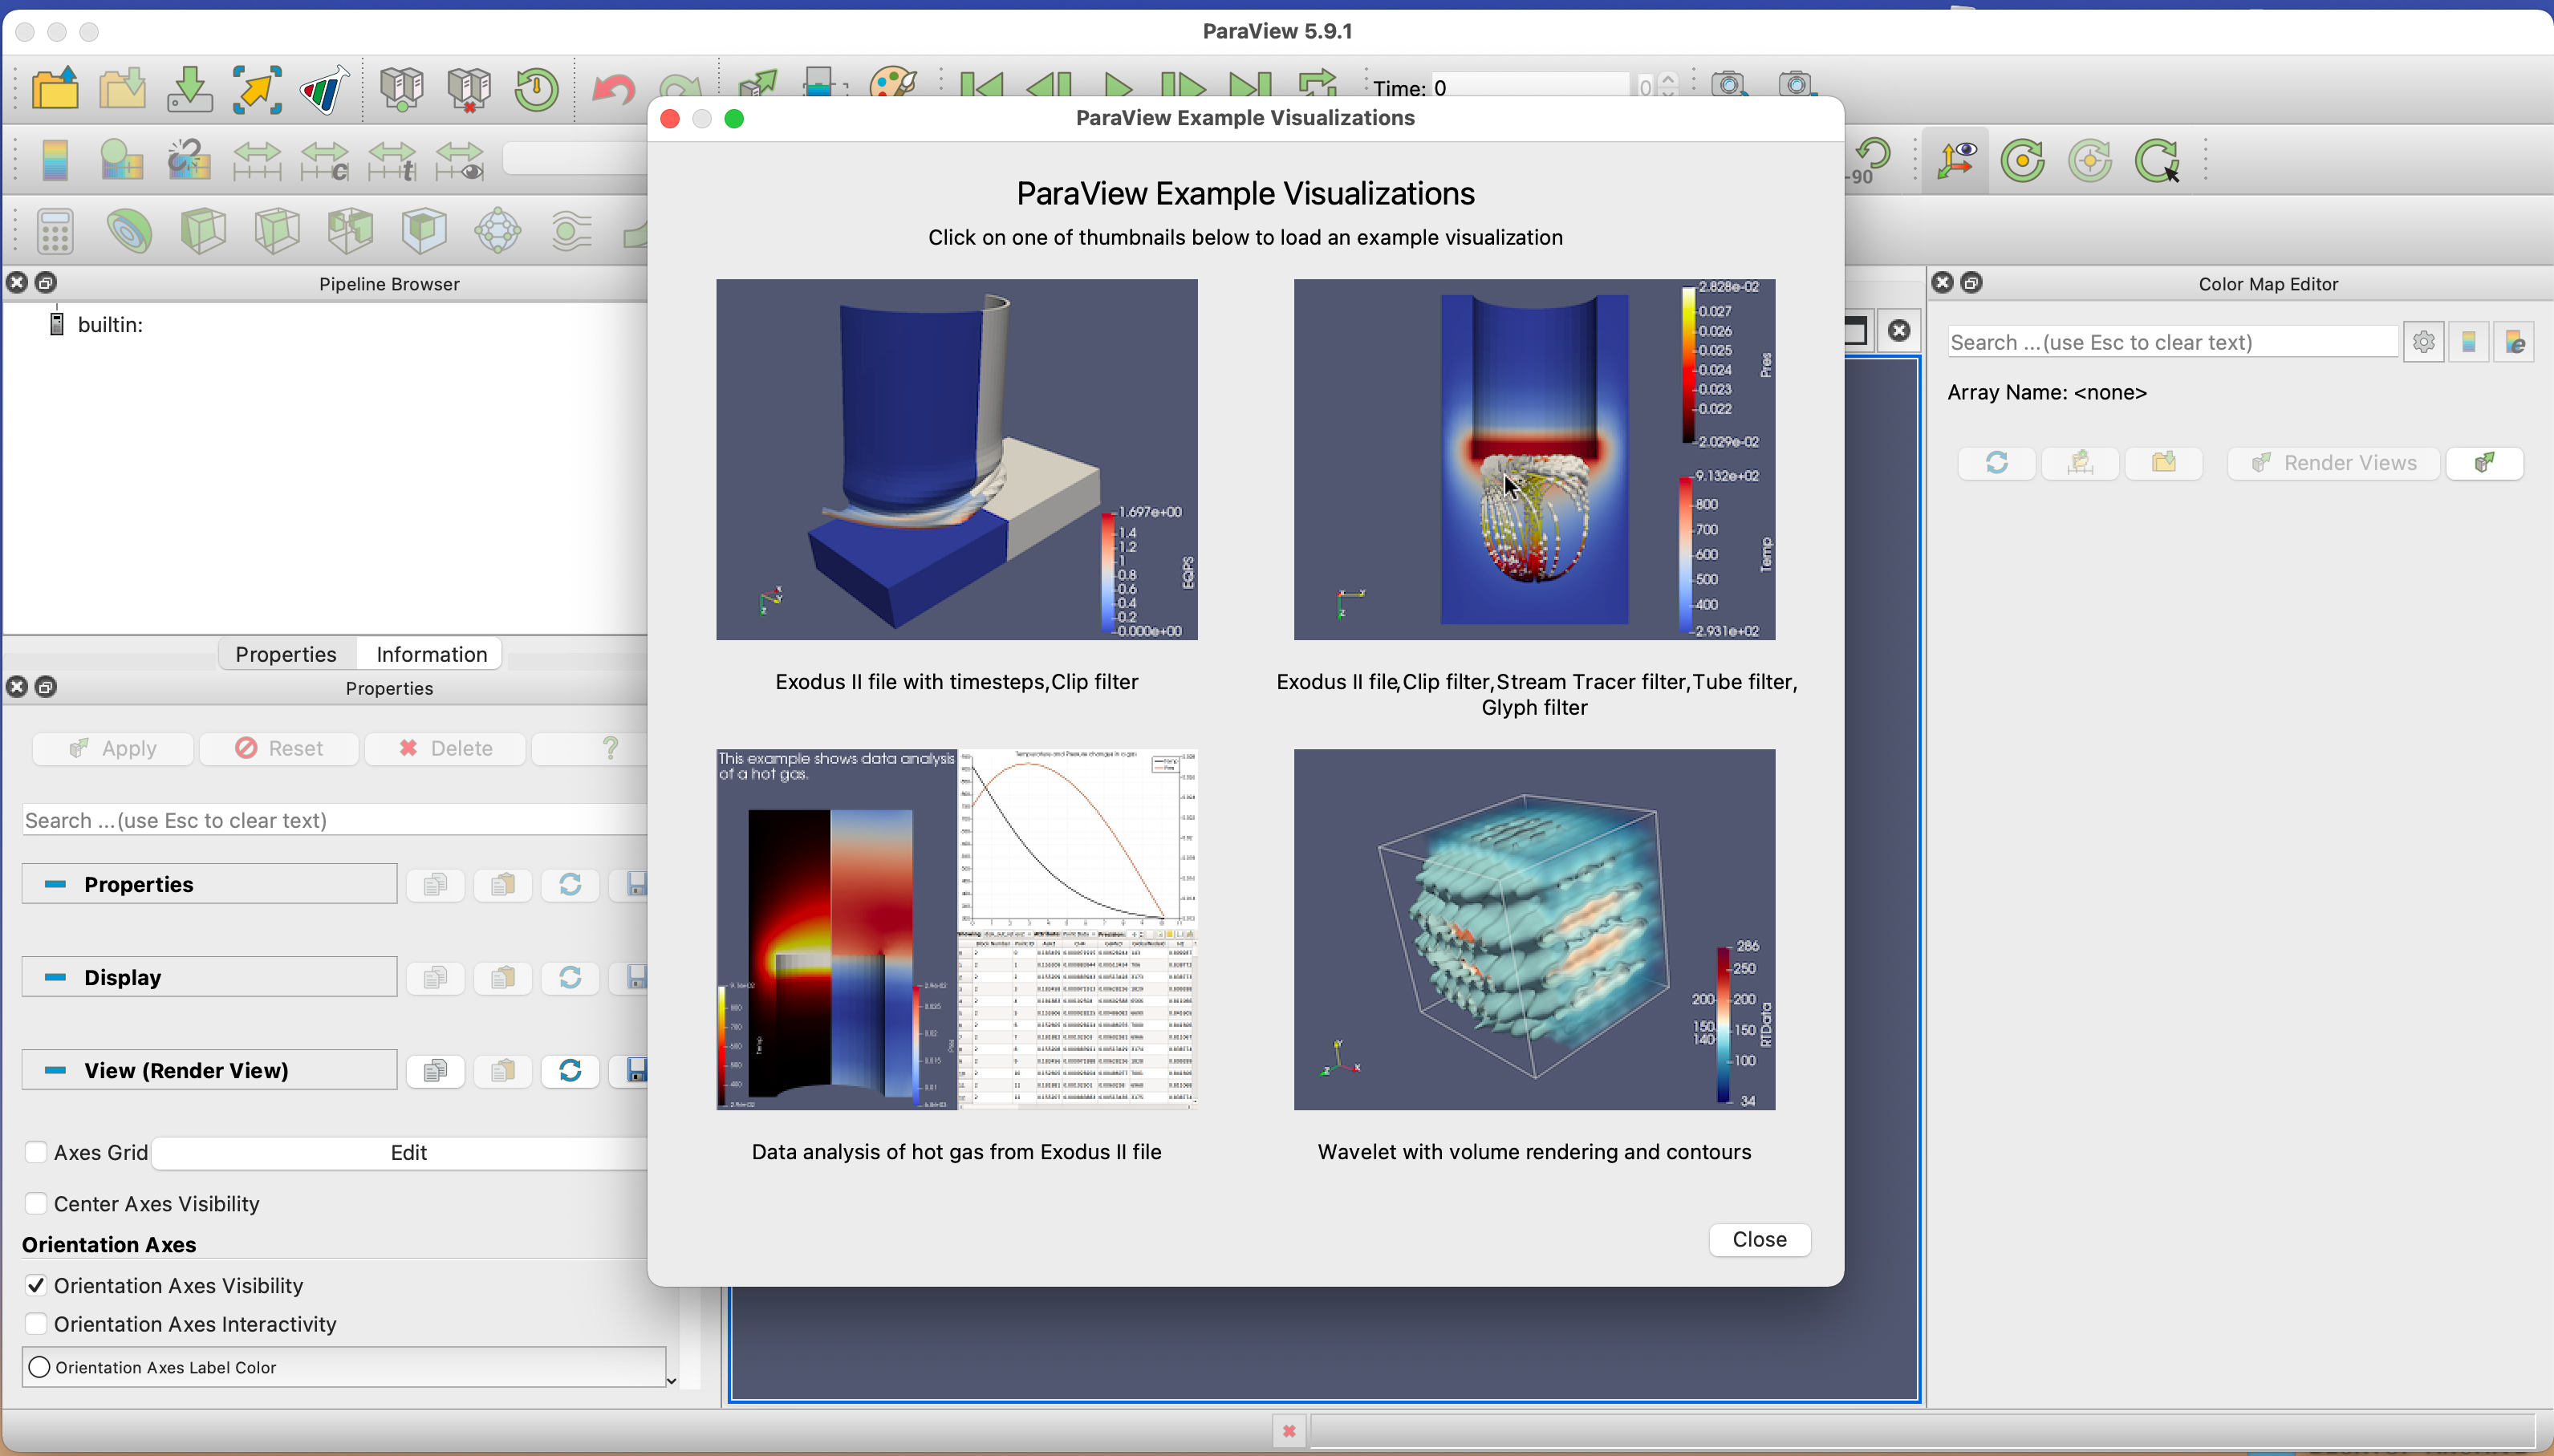
- If you select Example Visualizations you will be able to see four sample data visualizations. Click on those to explore how their pipelines were created.
Bio Break!
Let’s take a brief break to stretch before moving on to the next page. See you in a few minutes.